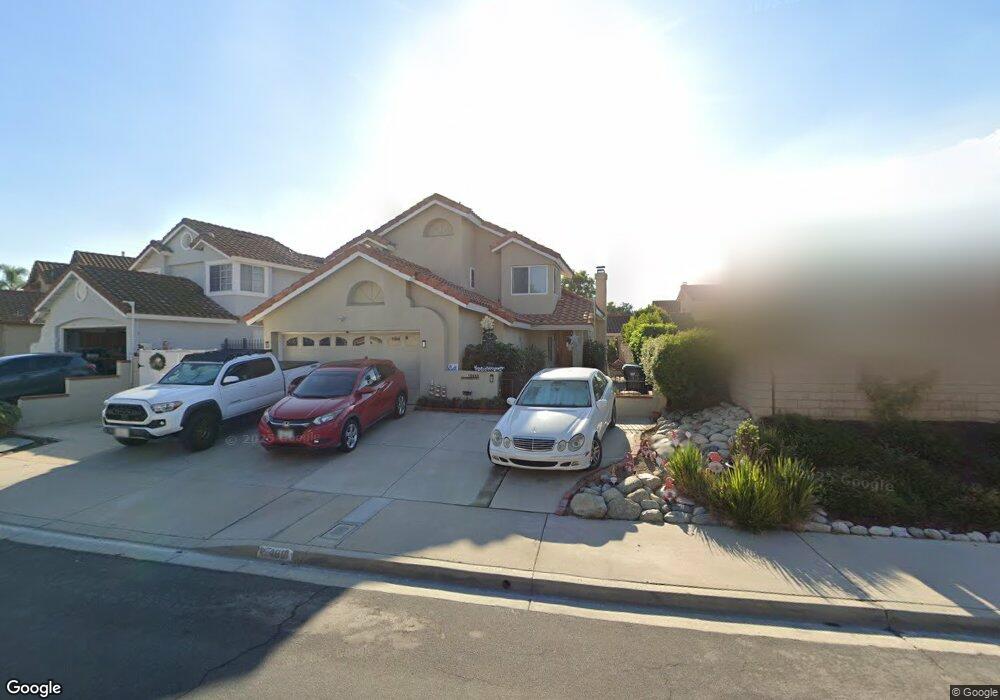
15468 Oak Springs Rd Chino Hills, CA 91709
South Chino Hills NeighborhoodEstimated Value: $887,877 - $992,000
4
Beds
3
Baths
1,979
Sq Ft
$484/Sq Ft
Est. Value
About This Home
This home is located at 15468 Oak Springs Rd, Chino Hills, CA 91709 and is currently estimated at $958,219, approximately $484 per square foot. 15468 Oak Springs Rd is a home located in San Bernardino County with nearby schools including Oak Ridge Elementary School, Robert O. Townsend Junior High School, and Chino Hills High School.
Ownership History
Date
Name
Owned For
Owner Type
Purchase Details
Closed on
Apr 14, 2022
Sold by
Luna Teodoro G
Bought by
Luna Family Trust and Luna
Current Estimated Value
Purchase Details
Closed on
Dec 31, 2003
Sold by
Luna Leila A
Bought by
Luna Teodoro Garcia
Home Financials for this Owner
Home Financials are based on the most recent Mortgage that was taken out on this home.
Original Mortgage
$313,600
Interest Rate
5.88%
Mortgage Type
Purchase Money Mortgage
Purchase Details
Closed on
Nov 19, 2003
Sold by
Alcasid Roehl D and Alcasid Marie C
Bought by
Luna Teodoro Garcia
Home Financials for this Owner
Home Financials are based on the most recent Mortgage that was taken out on this home.
Original Mortgage
$313,600
Interest Rate
5.88%
Mortgage Type
Purchase Money Mortgage
Create a Home Valuation Report for This Property
The Home Valuation Report is an in-depth analysis detailing your home's value as well as a comparison with similar homes in the area
Home Values in the Area
Average Home Value in this Area
Purchase History
| Date | Buyer | Sale Price | Title Company |
|---|---|---|---|
| Luna Family Trust | -- | None Listed On Document | |
| Luna Teodoro Garcia | -- | Lawyers Title Company | |
| Luna Teodoro Garcia | $392,000 | Lawyers Title Company |
Source: Public Records
Mortgage History
| Date | Status | Borrower | Loan Amount |
|---|---|---|---|
| Previous Owner | Luna Teodoro Garcia | $313,600 | |
| Closed | Luna Teodoro Garcia | $58,800 |
Source: Public Records
Tax History Compared to Growth
Tax History
| Year | Tax Paid | Tax Assessment Tax Assessment Total Assessment is a certain percentage of the fair market value that is determined by local assessors to be the total taxable value of land and additions on the property. | Land | Improvement |
|---|---|---|---|---|
| 2025 | $6,471 | $557,345 | $195,070 | $362,275 |
| 2024 | $6,471 | $546,417 | $191,245 | $355,172 |
| 2023 | $6,304 | $535,703 | $187,495 | $348,208 |
| 2022 | $6,268 | $525,199 | $183,819 | $341,380 |
| 2021 | $6,155 | $514,901 | $180,215 | $334,686 |
| 2020 | $6,081 | $509,621 | $178,367 | $331,254 |
| 2019 | $5,982 | $499,629 | $174,870 | $324,759 |
| 2018 | $5,859 | $489,832 | $171,441 | $318,391 |
| 2017 | $5,762 | $480,227 | $168,079 | $312,148 |
| 2016 | $5,415 | $470,810 | $164,783 | $306,027 |
| 2015 | $5,316 | $463,738 | $162,308 | $301,430 |
| 2014 | $5,219 | $454,654 | $159,129 | $295,525 |
Source: Public Records
Map
Nearby Homes
- 15526 Oakhurst St
- 15413 Oakgrove Ct
- 15531 Oakflats Rd
- 3099 Oaktrail Rd
- 15507 Oakdale Rd
- 0 Valle Vista Dr
- 3107 Morningside Dr
- 15520 Ficus St
- 15358 Morningside Dr
- 15740 Willow Run Dr
- 3027 Spyglass Ct
- 3072 Crape Myrtle Cir
- 2918 Crape Myrtle Cir
- 3581 Hillsdale Ranch Rd
- 3150 Oakcrest Dr
- 15770 Pistachio St
- 3473 Terrace Dr
- 3692 Glen Ridge Dr
- 15050 Avenida de Las Flores
- 3741 Aspen Ln
- 15476 Oak Springs Rd
- 15483 Oakflats Rd
- 15477 Oakflats Rd
- 15484 Oak Springs Rd
- 15489 Oakflats Rd
- 15492 Oak Springs Rd
- 15495 Oakflats Rd
- 15508 Oakhurst St
- 15465 Oak Springs Rd
- 15471 Oak Springs Rd
- 15459 Oak Springs Rd
- 15477 Oak Springs Rd
- 15501 Oakflats Rd
- 15514 Oakhurst St
- 15483 Oak Springs Rd
- 15447 Oak Springs Rd
- 15489 Oak Springs Rd
- 15507 Oakflats Rd
- 15520 Oakhurst St
- 15495 Oak Springs Rd