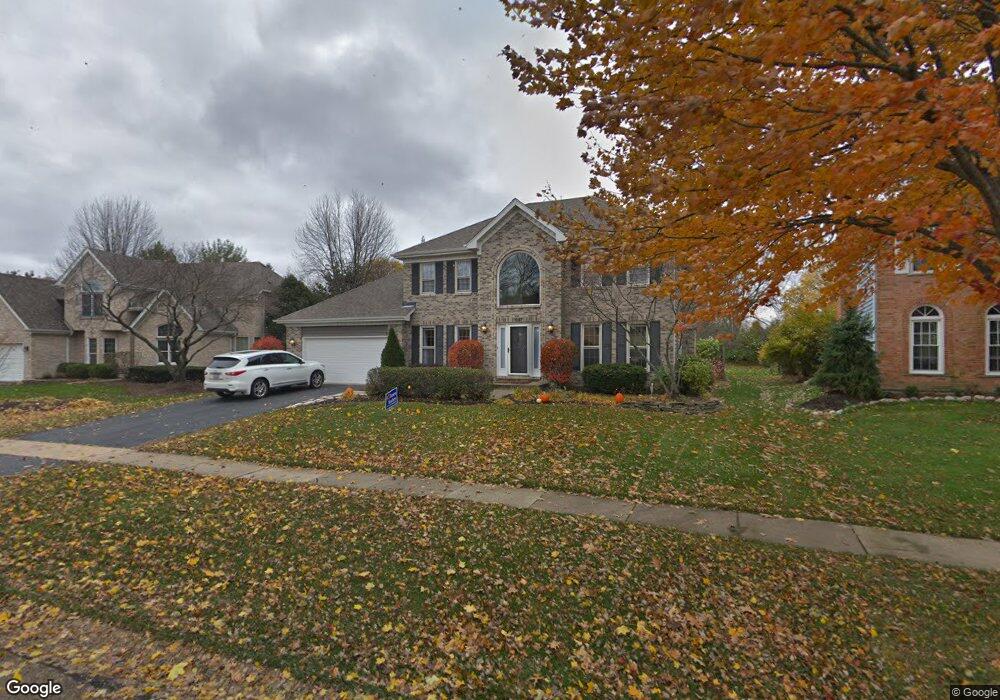
1547 Eagle Brook Dr Geneva, IL 60134
Eagle Brook NeighborhoodEstimated Value: $655,000 - $741,000
5
Beds
3
Baths
2,776
Sq Ft
$250/Sq Ft
Est. Value
About This Home
This home is located at 1547 Eagle Brook Dr, Geneva, IL 60134 and is currently estimated at $695,068, approximately $250 per square foot. 1547 Eagle Brook Dr is a home located in Kane County with nearby schools including Western Avenue Elementary School, Geneva Community High School, and St. Peter School.
Ownership History
Date
Name
Owned For
Owner Type
Purchase Details
Closed on
Dec 28, 2023
Sold by
Yacko Jacob and Yacko Janelle
Bought by
Yacko Janelle
Current Estimated Value
Purchase Details
Closed on
Oct 4, 2016
Sold by
Morello Patsy and Morello Rebecca
Bought by
Yacko Jacob and Yacko Janelle
Home Financials for this Owner
Home Financials are based on the most recent Mortgage that was taken out on this home.
Original Mortgage
$291,200
Interest Rate
4.19%
Mortgage Type
New Conventional
Purchase Details
Closed on
Aug 9, 2007
Sold by
Prusank Steven J and Prusank Sharon E
Bought by
Morello Patsy and Morello Rebecca
Home Financials for this Owner
Home Financials are based on the most recent Mortgage that was taken out on this home.
Original Mortgage
$247,500
Interest Rate
6.66%
Mortgage Type
Purchase Money Mortgage
Create a Home Valuation Report for This Property
The Home Valuation Report is an in-depth analysis detailing your home's value as well as a comparison with similar homes in the area
Home Values in the Area
Average Home Value in this Area
Purchase History
| Date | Buyer | Sale Price | Title Company |
|---|---|---|---|
| Yacko Janelle | -- | None Listed On Document | |
| Yacko Jacob | $364,000 | Attorneys Title Guaranty Fun | |
| Morello Patsy | $447,500 | Burnet Title |
Source: Public Records
Mortgage History
| Date | Status | Borrower | Loan Amount |
|---|---|---|---|
| Previous Owner | Yacko Jacob | $291,200 | |
| Previous Owner | Morello Patsy | $247,500 |
Source: Public Records
Tax History
| Year | Tax Paid | Tax Assessment Tax Assessment Total Assessment is a certain percentage of the fair market value that is determined by local assessors to be the total taxable value of land and additions on the property. | Land | Improvement |
|---|---|---|---|---|
| 2024 | $13,617 | $184,835 | $57,367 | $127,468 |
| 2023 | $13,210 | $168,032 | $52,152 | $115,880 |
| 2022 | $12,617 | $156,134 | $48,459 | $107,675 |
| 2021 | $12,253 | $150,331 | $46,658 | $103,673 |
| 2020 | $12,116 | $148,037 | $45,946 | $102,091 |
| 2019 | $12,086 | $145,234 | $45,076 | $100,158 |
| 2018 | $11,612 | $139,986 | $45,076 | $94,910 |
| 2017 | $12,135 | $143,627 | $43,874 | $99,753 |
| 2016 | $12,197 | $141,686 | $43,281 | $98,405 |
| 2015 | -- | $134,708 | $41,149 | $93,559 |
| 2014 | -- | $127,692 | $41,149 | $86,543 |
| 2013 | -- | $127,692 | $41,149 | $86,543 |
Source: Public Records
Map
Nearby Homes
- 1580 Turnberry Ct
- 758 Riverbank Dr
- 999 Sunset Rd
- 1145 Keim Ct
- 705 W Fabyan Pkwy
- 629 Peck Rd
- 1823 Fargo Blvd
- 655 Blackhawk Dr
- 839 S Randall Rd
- 369 Fritz Ln
- 545 Blackhawk Dr Unit 2
- 301 Country Club Place
- 1736 Kaneville Rd
- Unit 6A Prairie Grove Dr
- Unit 5B Prairie Grove Dr
- Unit 4A Prairie Grove Dr
- Unit 5A Prairie Grove Dr
- Unit 4B Prairie Grove Dr
- Unit 7A Prairie Grove Dr
- Unit 6C Prairie Grove Dr
- 1527 Eagle Brook Dr
- 1557 Eagle Brook Dr
- 1521 Eagle Brook Dr
- 1530 Eagle Brook Dr
- 1550 Eagle Brook Dr
- 1561 Eagle Brook Dr
- 1500 Eagle Brook Dr Unit 1
- 1451 Eagle Brook Dr
- 1587 Eagle Brook Dr
- 1541 Turnberry Ct
- 1448 Eagle Brook Dr Unit 1
- 1443 Eagle Brook Dr
- 1531 Turnberry Ct
- 1589 Eagle Brook Dr
- 1440 Eagle Brook Dr
- 1441 Pinto Ct
- 1570 Turnberry Ct
- 1521 Turnberry Ct
- 1600 Bunker Ct
- 1560 Turnberry Ct
Your Personal Tour Guide
Ask me questions while you tour the home.