Estimated Value: $925,000 - $966,000
3
Beds
3
Baths
1,803
Sq Ft
$522/Sq Ft
Est. Value
About This Home
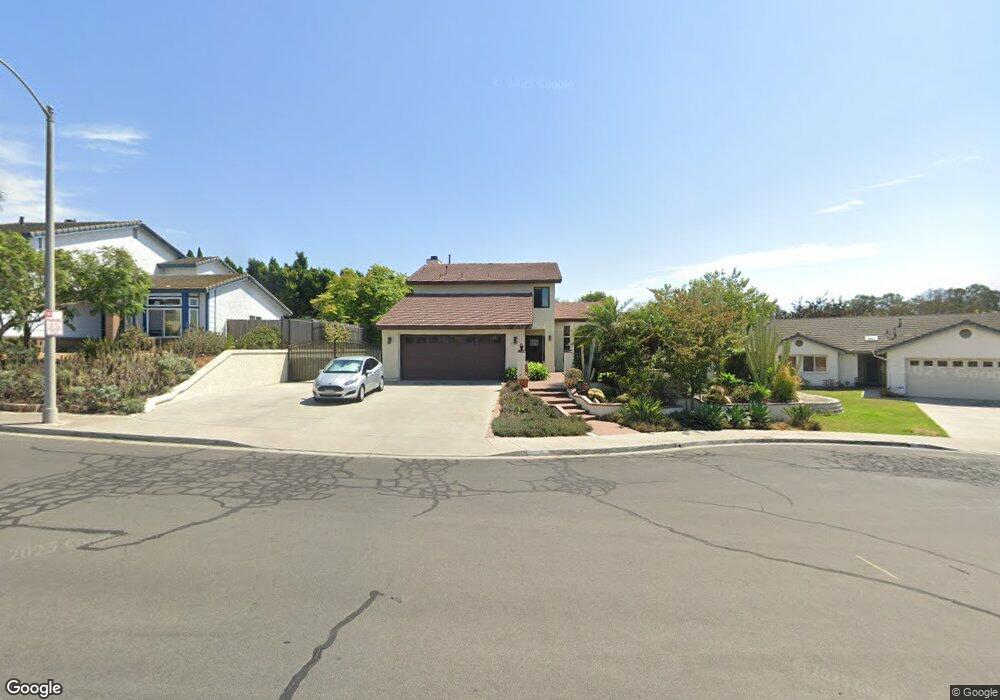
This home is located at 1547 Merlot Ct, Vista, CA 92083 and is currently estimated at $941,917, approximately $522 per square foot. 1547 Merlot Ct is a home located in San Diego County with nearby schools including Grapevine Elementary School, Madison Middle School, and Rancho Buena Vista High School.
Ownership History
Date
Name
Owned For
Owner Type
Purchase Details
Closed on
Dec 20, 2019
Sold by
Carstensen Raymond Henry and Carstensen Sharon M
Bought by
Foster Brian and Foster Melissa
Current Estimated Value
Home Financials for this Owner
Home Financials are based on the most recent Mortgage that was taken out on this home.
Original Mortgage
$373,200
Interest Rate
3.6%
Mortgage Type
Commercial
Purchase Details
Closed on
Mar 15, 2010
Sold by
Grubb James E and Grubb Lourie J
Bought by
Carstensen Ii Raymond Henry and Carstensen Sharon M
Home Financials for this Owner
Home Financials are based on the most recent Mortgage that was taken out on this home.
Original Mortgage
$294,566
Interest Rate
4.88%
Mortgage Type
FHA
Purchase Details
Closed on
Aug 22, 1988
Bought by
Grubb James E Lourie J
Create a Home Valuation Report for This Property
The Home Valuation Report is an in-depth analysis detailing your home's value as well as a comparison with similar homes in the area
Home Values in the Area
Average Home Value in this Area
Purchase History
| Date | Buyer | Sale Price | Title Company |
|---|---|---|---|
| Foster Brian | $375,000 | Chicago Title | |
| Carstensen Ii Raymond Henry | $300,000 | Advantage Title Company | |
| Grubb James E Lourie J | $138,900 | -- |
Source: Public Records
Mortgage History
| Date | Status | Borrower | Loan Amount |
|---|---|---|---|
| Previous Owner | Foster Brian | $373,200 | |
| Previous Owner | Carstensen Ii Raymond Henry | $294,566 |
Source: Public Records
Tax History Compared to Growth
Tax History
| Year | Tax Paid | Tax Assessment Tax Assessment Total Assessment is a certain percentage of the fair market value that is determined by local assessors to be the total taxable value of land and additions on the property. | Land | Improvement |
|---|---|---|---|---|
| 2025 | $5,081 | $410,111 | $120,951 | $289,160 |
| 2024 | $5,081 | $402,071 | $118,580 | $283,491 |
| 2023 | $4,975 | $394,188 | $116,255 | $277,933 |
| 2022 | $4,963 | $386,460 | $113,976 | $272,484 |
| 2021 | $4,159 | $378,884 | $111,742 | $267,142 |
| 2020 | $4,593 | $354,082 | $104,428 | $249,654 |
| 2019 | $4,529 | $347,140 | $102,381 | $244,759 |
| 2018 | $4,339 | $340,334 | $100,374 | $239,960 |
| 2017 | $120 | $333,661 | $98,406 | $235,255 |
| 2016 | $4,171 | $327,120 | $96,477 | $230,643 |
| 2015 | $4,147 | $322,207 | $95,028 | $227,179 |
| 2014 | $4,048 | $315,896 | $93,167 | $222,729 |
Source: Public Records
Map
Nearby Homes
- 933 Ruby Dr
- 1713 Cameo Dr
- 1532 Olive Ave
- 0 Galaxy Dr
- 523 Hatherly St
- 2220 Bliss Cir
- 748 Granada Dr
- 1636 Jonathon St
- 4137 Alana Cir
- 320 Grapevine Rd Unit 9
- 1283 Winchester Ct
- 1333 Olive Ave Unit 37
- 1333 Olive Ave Unit 62
- 1333 Olive Ave Unit 54
- 4228 Lewis St
- 2839 Emerald Dr
- 4142 Ocaso Way
- 211 Silver Fir Ct
- 323 Hill Dr
- 1414 Janis Lynn Ln
- 1541 Merlot Ct
- 1553 Merlot Ct
- 1559 Merlot Ct
- 1638 Steeplechase Place
- 1546 Merlot Ct
- 1640 Steeplechase Place
- 1634 Steeplechase Place
- 1540 Merlot Ct
- 1529 Merlot Ct
- 1558 Merlot Ct
- 887 Ruby Dr
- 1648 Steeplechase Place
- 1534 Merlot Ct
- 1630 Steeplechase Place
- 1622 Steeplechase Place
- 891 Ruby Dr
- 1656 Steeplechase Place
- 1523 Merlot Ct
- 1528 Merlot Ct
- 883 Ruby Dr