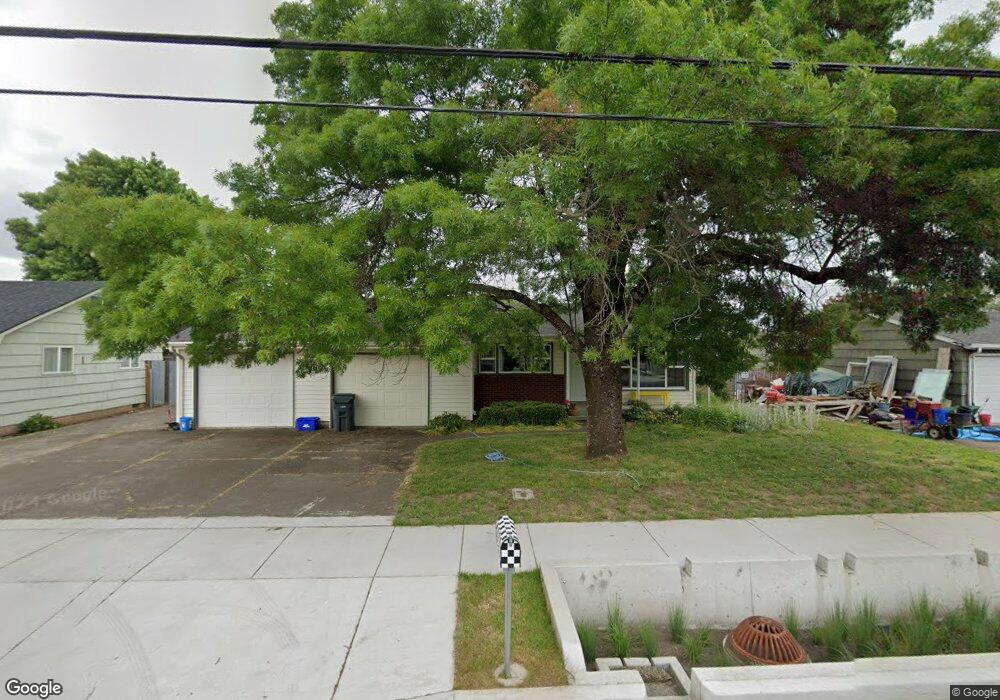
1547 N Park Ave Eugene, OR 97404
River Road NeighborhoodEstimated Value: $373,000 - $392,000
3
Beds
2
Baths
1,373
Sq Ft
$281/Sq Ft
Est. Value
About This Home
This home is located at 1547 N Park Ave, Eugene, OR 97404 and is currently estimated at $386,364, approximately $281 per square foot. 1547 N Park Ave is a home located in Lane County with nearby schools including Howard Elementary School, Kelly Middle School, and North Eugene High School.
Ownership History
Date
Name
Owned For
Owner Type
Purchase Details
Closed on
Apr 15, 2015
Sold by
Steiner Bonnie
Bought by
Wanner Kori and Trant John P
Current Estimated Value
Home Financials for this Owner
Home Financials are based on the most recent Mortgage that was taken out on this home.
Original Mortgage
$148,750
Outstanding Balance
$114,012
Interest Rate
3.7%
Mortgage Type
New Conventional
Estimated Equity
$272,352
Purchase Details
Closed on
Feb 27, 2002
Sold by
Trefren Tymothy L and Trefren Pauline J
Bought by
Steiner Bonnie
Home Financials for this Owner
Home Financials are based on the most recent Mortgage that was taken out on this home.
Original Mortgage
$112,500
Interest Rate
5.87%
Purchase Details
Closed on
Jun 2, 1999
Sold by
Williams Harold D
Bought by
Trefren Timothy L and Trefren Pauline J
Home Financials for this Owner
Home Financials are based on the most recent Mortgage that was taken out on this home.
Original Mortgage
$114,240
Interest Rate
6.84%
Mortgage Type
VA
Create a Home Valuation Report for This Property
The Home Valuation Report is an in-depth analysis detailing your home's value as well as a comparison with similar homes in the area
Home Values in the Area
Average Home Value in this Area
Purchase History
| Date | Buyer | Sale Price | Title Company |
|---|---|---|---|
| Wanner Kori | $175,000 | Western Title & Escrow Co | |
| Steiner Bonnie | $125,000 | Cascade Title Co | |
| Trefren Timothy L | $112,000 | Cascade Title Co |
Source: Public Records
Mortgage History
| Date | Status | Borrower | Loan Amount |
|---|---|---|---|
| Open | Wanner Kori | $148,750 | |
| Previous Owner | Steiner Bonnie | $112,500 | |
| Previous Owner | Trefren Timothy L | $114,240 |
Source: Public Records
Tax History Compared to Growth
Tax History
| Year | Tax Paid | Tax Assessment Tax Assessment Total Assessment is a certain percentage of the fair market value that is determined by local assessors to be the total taxable value of land and additions on the property. | Land | Improvement |
|---|---|---|---|---|
| 2025 | $3,051 | $181,593 | -- | -- |
| 2024 | $3,018 | $176,304 | -- | -- |
| 2023 | $3,018 | $171,169 | $0 | $0 |
| 2022 | $2,838 | $166,184 | $0 | $0 |
| 2021 | $2,639 | $161,344 | $0 | $0 |
| 2020 | $2,658 | $156,645 | $0 | $0 |
| 2019 | $2,564 | $152,083 | $0 | $0 |
| 2018 | $2,392 | $143,353 | $0 | $0 |
| 2017 | $2,251 | $143,353 | $0 | $0 |
| 2016 | $2,124 | $139,178 | $0 | $0 |
| 2015 | $2,046 | $135,124 | $0 | $0 |
| 2014 | $2,040 | $131,188 | $0 | $0 |
Source: Public Records
Map
Nearby Homes
- 1063 Boyce St
- 1765 Labona Dr
- 0 N Park Alley
- 1745 Grove St
- 1306 David Ave
- 1310 David Ave
- 1764 Dalton Dr
- 725 Greg Way
- 1742 Escalante St
- 2110 Labona Dr
- 780 Cornwall Ave
- 507 Littlewood Ln
- 2002 Kintyre St
- 1880 Manihi Dr
- 1621 Skipper Ave
- 0 N Park Ave Unit 487111683
- 0 N Park Ave Unit 453228406
- 1164 Veronica Ln
- 3741 Century Dr
- 0 Pacific Hwy W
- 1585 N Park Ave
- 1545 N Park Ave
- 1558 Alderwood St
- 1570 Alderwood St
- 1546 Alderwood St
- 1589 N Park Ave
- 1533 N Park Ave
- 1534 Alderwood St
- 1586 Alderwood St
- 1580 N Park Ave
- 1593 N Park Ave
- 1521 N Park Ave
- 1522 Alderwood St
- 1559 Alderwood St
- 1573 Alderwood St
- 1547 Alderwood St
- 910 Westsprings Dr
- 1535 Alderwood St
- 860 Elm Dr
- 1595 N Park Ave