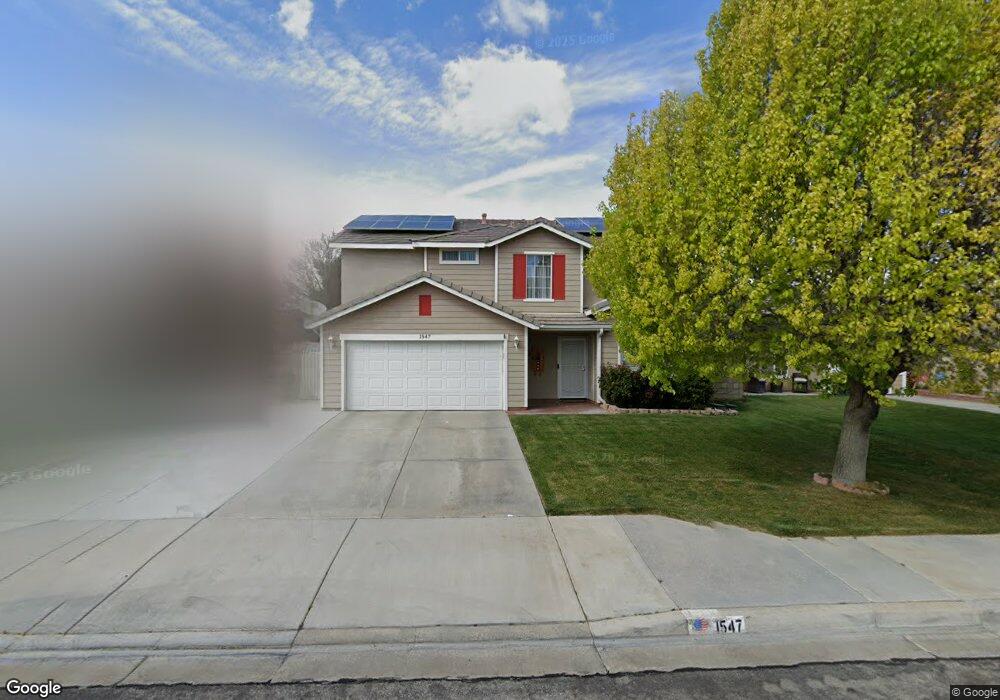
1547 W Holguin St Lancaster, CA 93534
Central Lancaster NeighborhoodEstimated Value: $472,000 - $534,116
3
Beds
3
Baths
2,220
Sq Ft
$229/Sq Ft
Est. Value
About This Home
This home is located at 1547 W Holguin St, Lancaster, CA 93534 and is currently estimated at $507,529, approximately $228 per square foot. 1547 W Holguin St is a home located in Los Angeles County with nearby schools including Desert View Elementary School, Piute Middle School, and Lancaster High School.
Ownership History
Date
Name
Owned For
Owner Type
Purchase Details
Closed on
Jul 9, 2015
Sold by
Cox Albert M
Bought by
The Cox Trust
Current Estimated Value
Purchase Details
Closed on
Aug 6, 2008
Sold by
Federal Home Loan Mortgage Corporation
Bought by
Wood June and Wood Ernie
Home Financials for this Owner
Home Financials are based on the most recent Mortgage that was taken out on this home.
Original Mortgage
$196,425
Outstanding Balance
$130,554
Interest Rate
6.59%
Mortgage Type
FHA
Estimated Equity
$376,975
Purchase Details
Closed on
May 28, 2008
Sold by
Leake Jacklyan A and Leake Roy Edward
Bought by
Federal Home Loan Mortgage Corporation
Purchase Details
Closed on
Oct 23, 2001
Sold by
Kb Home Greater Los Angeles Inc
Bought by
Leake Roy Edward
Home Financials for this Owner
Home Financials are based on the most recent Mortgage that was taken out on this home.
Original Mortgage
$175,099
Interest Rate
6.62%
Mortgage Type
FHA
Create a Home Valuation Report for This Property
The Home Valuation Report is an in-depth analysis detailing your home's value as well as a comparison with similar homes in the area
Home Values in the Area
Average Home Value in this Area
Purchase History
| Date | Buyer | Sale Price | Title Company |
|---|---|---|---|
| The Cox Trust | -- | None Available | |
| Wood June | $200,000 | Chicago Title Company | |
| Federal Home Loan Mortgage Corporation | $214,500 | Accommodation | |
| Leake Roy Edward | $178,000 | Chicago Title |
Source: Public Records
Mortgage History
| Date | Status | Borrower | Loan Amount |
|---|---|---|---|
| Open | Wood June | $196,425 | |
| Previous Owner | Leake Roy Edward | $175,099 | |
| Closed | Leake Roy Edward | $5,335 |
Source: Public Records
Tax History Compared to Growth
Tax History
| Year | Tax Paid | Tax Assessment Tax Assessment Total Assessment is a certain percentage of the fair market value that is determined by local assessors to be the total taxable value of land and additions on the property. | Land | Improvement |
|---|---|---|---|---|
| 2025 | $4,678 | $280,291 | $51,502 | $228,789 |
| 2024 | $4,678 | $274,796 | $50,493 | $224,303 |
| 2023 | $4,582 | $269,408 | $49,503 | $219,905 |
| 2022 | $4,470 | $264,127 | $48,533 | $215,594 |
| 2021 | $4,061 | $258,949 | $47,582 | $211,367 |
| 2019 | $3,945 | $251,271 | $46,172 | $205,099 |
| 2018 | $3,585 | $226,345 | $45,267 | $181,078 |
| 2016 | $3,311 | $217,558 | $43,510 | $174,048 |
| 2015 | $3,268 | $214,291 | $42,857 | $171,434 |
| 2014 | $2,830 | $175,000 | $35,000 | $140,000 |
Source: Public Records
Map
Nearby Homes
- 45629 Barham Ave
- 0 Vac Vic Avenue I12 131 Ste Unit SR24209235
- 45704 Barham Ave
- 45503 Lorimer Ave
- 1753 Stratford St
- 1560 W Avenue h10
- 1411 W Avenue h9
- Industrial Lot G8 15 Vac Vic Ave
- 0 Victoria Ave
- 90 Victoria Ave
- 230 Victoria Ave
- 50 Victoria Ave
- 0 91 Stw Vic Ave G6
- 1328 W Avenue H-6
- 45439 Lorimer Ave
- 45550 Fairbanks Ave
- 45433 Lorimer Ave
- 45764 Victoria Ave
- 1751 W Avenue h5
- 1258 W Avenue h6
- 1541 W Holguin St
- 1548 Torbay Ct
- 1542 Torbay Ct
- 1559 W Holguin St
- 1535 W Holguin St
- 1554 Torbay Ct
- 1536 Torbay Ct
- 1548 W Holguin St
- 1602 Torbay Ct
- 1603 W Holguin St
- 1531 W Holguin St
- 1554 W Holguin St
- 1542 W Holguin St
- 1536 W Holguin St
- 1558 W Holguin St
- 1530 Torbay Ct
- 1608 Torbay Ct
- 1525 W Holguin St
- 1609 W Holguin St
- 1602 W Holguin St