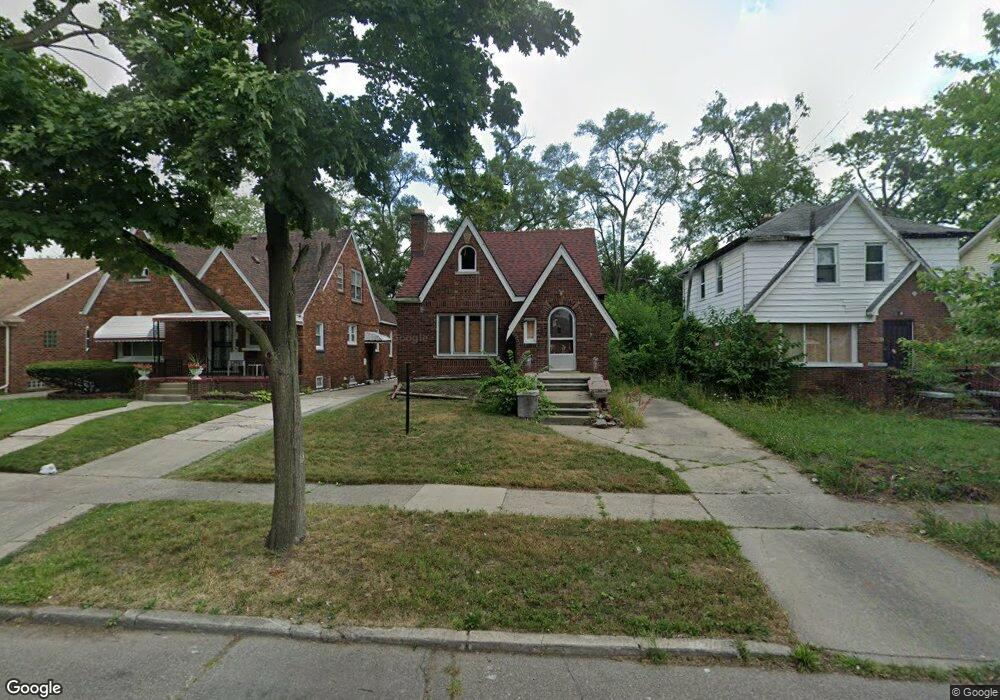
15474 Robson St Detroit, MI 48227
Belmont NeighborhoodEstimated Value: $80,285 - $122,000
3
Beds
2
Baths
1,350
Sq Ft
$75/Sq Ft
Est. Value
About This Home
This home is located at 15474 Robson St, Detroit, MI 48227 and is currently estimated at $101,071, approximately $74 per square foot. 15474 Robson St is a home located in Wayne County with nearby schools including Young Coleman A. Elementary School, John R. King Academic And Performing Arts Academy, and Charles L. Spain Elementary-Middle School.
Ownership History
Date
Name
Owned For
Owner Type
Purchase Details
Closed on
Jun 9, 2025
Sold by
Ray Isaiah
Bought by
Ray Damone
Current Estimated Value
Purchase Details
Closed on
Apr 10, 2020
Sold by
Ray Damone
Bought by
Ray Isaiah
Purchase Details
Closed on
Dec 10, 2019
Sold by
Ray Byron
Bought by
Ray Damone
Purchase Details
Closed on
Nov 22, 2019
Sold by
County Of Wayne
Bought by
Ray Byron
Purchase Details
Closed on
May 18, 2018
Sold by
Nelson Nicole L and Nelson Jamar A
Bought by
Reec Enterprises Llc
Purchase Details
Closed on
Mar 29, 2016
Sold by
Reec Enterprises Llc
Bought by
Carter Jamar Alvin
Purchase Details
Closed on
Nov 7, 2013
Sold by
Wayne County Treasurer
Bought by
Reec Enterprises Llc
Purchase Details
Closed on
Jan 31, 2010
Sold by
Derrico I Deon D
Bought by
Derrico Holdings Corporation
Purchase Details
Closed on
Dec 21, 2005
Sold by
Roberts Eugene and Roberts Josephine Reynolds
Bought by
Derrico Deon
Create a Home Valuation Report for This Property
The Home Valuation Report is an in-depth analysis detailing your home's value as well as a comparison with similar homes in the area
Home Values in the Area
Average Home Value in this Area
Purchase History
| Date | Buyer | Sale Price | Title Company |
|---|---|---|---|
| Ray Damone | -- | None Listed On Document | |
| Ray Damone | -- | None Listed On Document | |
| Ray Isaiah | -- | None Available | |
| Ray Damone | -- | None Available | |
| Ray Byron | $20,000 | None Available | |
| Reec Enterprises Llc | -- | None Available | |
| Carter Jamar Alvin | -- | None Available | |
| Reec Enterprises Llc | $6,200 | None Available | |
| Derrico Holdings Corporation | -- | None Available | |
| Derrico Deon | $130,000 | Wolverine Title |
Source: Public Records
Tax History Compared to Growth
Tax History
| Year | Tax Paid | Tax Assessment Tax Assessment Total Assessment is a certain percentage of the fair market value that is determined by local assessors to be the total taxable value of land and additions on the property. | Land | Improvement |
|---|---|---|---|---|
| 2025 | $1,163 | $29,100 | $0 | $0 |
| 2024 | $1,163 | $25,000 | $0 | $0 |
| 2023 | $1,128 | $20,000 | $0 | $0 |
| 2022 | $1,201 | $15,700 | $0 | $0 |
| 2021 | $1,169 | $13,100 | $0 | $0 |
| 2020 | $1,169 | $12,900 | $0 | $0 |
| 2019 | $1,151 | $10,300 | $0 | $0 |
| 2018 | $781 | $9,200 | $0 | $0 |
| 2017 | $173 | $9,100 | $0 | $0 |
| 2016 | $1,557 | $17,400 | $0 | $0 |
| 2015 | $1,740 | $17,400 | $0 | $0 |
| 2013 | $2,451 | $24,506 | $0 | $0 |
| 2010 | -- | $35,113 | $972 | $34,141 |
Source: Public Records
Map
Nearby Homes
- 15509 Lauder St
- 15499 Lauder St
- 15707 Lauder St
- 15461 Marlowe St
- 15731 Lauder St
- 15452 Marlowe St
- 15432 Marlowe St
- 15746 Coyle St
- 15355 Coyle St
- 15366 Sussex St
- 15455 Hubbell St
- 15760 Lauder St
- 15350 Sussex St
- 15808 Coyle St
- 15836 Coyle St
- 15443 Whitcomb St
- 15319 Sussex St
- 15748 Hubbell St
- 15318 Whitcomb St
- 15872 Coyle St
- 15486 Robson St
- 15468 Robson St
- 15477 Lauder St
- 15460 Robson St
- 15494 Robson St
- 15485 Lauder St
- 15491 Lauder St
- 15500 Robson St
- 15450 Robson St
- 15451 Lauder St
- 15467 Lauder St
- 15510 Robson St
- 15444 Robson St
- 15461 Lauder St
- 15477 Robson St
- 15469 Robson St
- 15485 Robson St
- 15445 Lauder St
- 15491 Robson St
- 15461 Robson St