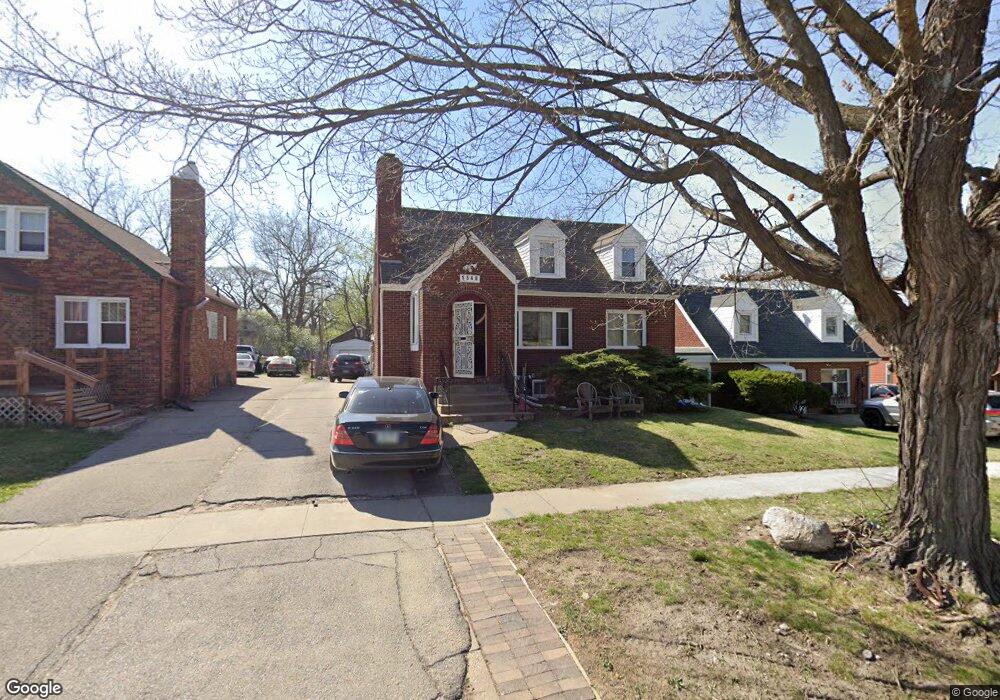
1548 29th St Des Moines, IA 50311
Drake NeighborhoodEstimated Value: $190,000 - $215,799
2
Beds
3
Baths
1,183
Sq Ft
$171/Sq Ft
Est. Value
About This Home
This home is located at 1548 29th St, Des Moines, IA 50311 and is currently estimated at $202,700, approximately $171 per square foot. 1548 29th St is a home located in Polk County with nearby schools including Perkins Elementary School, Meredith Middle School, and Hoover High School.
Ownership History
Date
Name
Owned For
Owner Type
Purchase Details
Closed on
Sep 16, 2013
Sold by
Buldhaupt Preshia P
Bought by
Buldhaupt Bruce L
Current Estimated Value
Purchase Details
Closed on
Mar 11, 2000
Sold by
Woolson Anna R and Woolson John R
Bought by
Buldhaupt Bruce L
Create a Home Valuation Report for This Property
The Home Valuation Report is an in-depth analysis detailing your home's value as well as a comparison with similar homes in the area
Home Values in the Area
Average Home Value in this Area
Purchase History
| Date | Buyer | Sale Price | Title Company |
|---|---|---|---|
| Buldhaupt Bruce L | -- | None Available | |
| Buldhaupt Bruce L | $69,500 | -- |
Source: Public Records
Tax History Compared to Growth
Tax History
| Year | Tax Paid | Tax Assessment Tax Assessment Total Assessment is a certain percentage of the fair market value that is determined by local assessors to be the total taxable value of land and additions on the property. | Land | Improvement |
|---|---|---|---|---|
| 2025 | $3,066 | $197,100 | $35,900 | $161,200 |
| 2024 | $3,066 | $175,000 | $31,400 | $143,600 |
| 2023 | $3,698 | $175,000 | $31,400 | $143,600 |
| 2022 | $3,668 | $169,200 | $26,600 | $142,600 |
| 2021 | $3,464 | $169,200 | $26,600 | $142,600 |
| 2020 | $3,592 | $150,700 | $23,600 | $127,100 |
| 2019 | $3,312 | $150,700 | $23,600 | $127,100 |
| 2018 | $3,270 | $135,000 | $20,600 | $114,400 |
| 2017 | $3,328 | $135,000 | $20,600 | $114,400 |
| 2016 | $3,234 | $134,800 | $18,700 | $116,100 |
| 2015 | $3,234 | $134,800 | $18,700 | $116,100 |
| 2014 | $3,212 | $132,900 | $18,000 | $114,900 |
Source: Public Records
Map
Nearby Homes