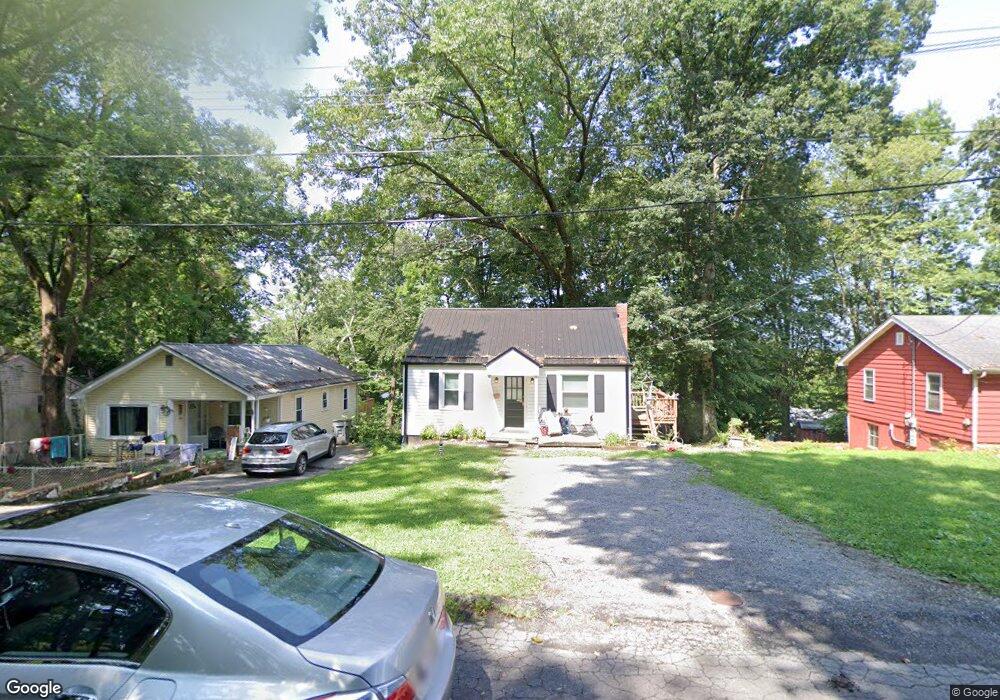
1548 Rock Rose Rd Bristol, TN 37620
Estimated Value: $117,934 - $174,000
2
Beds
1
Bath
756
Sq Ft
$189/Sq Ft
Est. Value
About This Home
This home is located at 1548 Rock Rose Rd, Bristol, TN 37620 and is currently estimated at $142,734, approximately $188 per square foot. 1548 Rock Rose Rd is a home located in Sullivan County with nearby schools including Holston View Elementary School, Vance Middle School, and Tennessee High School.
Ownership History
Date
Name
Owned For
Owner Type
Purchase Details
Closed on
Oct 27, 2022
Sold by
Barrett Joshua W and Barrett Megan
Bought by
Barrett Investments Llc
Current Estimated Value
Purchase Details
Closed on
Mar 15, 2020
Sold by
County Of Sullivan
Bought by
Big Inc
Purchase Details
Closed on
Jun 22, 2007
Sold by
Rex Brewer
Bought by
Nelson Angela D
Home Financials for this Owner
Home Financials are based on the most recent Mortgage that was taken out on this home.
Original Mortgage
$63,002
Interest Rate
6.35%
Purchase Details
Closed on
Mar 11, 2004
Sold by
Karnatov Sergey P and Karnatov Tatyana
Bought by
Rex Brewer
Home Financials for this Owner
Home Financials are based on the most recent Mortgage that was taken out on this home.
Original Mortgage
$49,608
Interest Rate
5.62%
Purchase Details
Closed on
Jul 14, 1998
Sold by
Surratt Lewis C and Surratt Betty O
Bought by
Sergey Karnaton
Purchase Details
Closed on
Apr 23, 1990
Create a Home Valuation Report for This Property
The Home Valuation Report is an in-depth analysis detailing your home's value as well as a comparison with similar homes in the area
Home Values in the Area
Average Home Value in this Area
Purchase History
| Date | Buyer | Sale Price | Title Company |
|---|---|---|---|
| Barrett Investments Llc | -- | -- | |
| Big Inc | $19,000 | None Available | |
| Nelson Angela D | $63,500 | -- | |
| Rex Brewer | $50,000 | -- | |
| Sergey Karnaton | $39,000 | -- | |
| -- | $25,000 | -- |
Source: Public Records
Mortgage History
| Date | Status | Borrower | Loan Amount |
|---|---|---|---|
| Previous Owner | -- | $63,002 | |
| Previous Owner | -- | $49,608 |
Source: Public Records
Tax History Compared to Growth
Tax History
| Year | Tax Paid | Tax Assessment Tax Assessment Total Assessment is a certain percentage of the fair market value that is determined by local assessors to be the total taxable value of land and additions on the property. | Land | Improvement |
|---|---|---|---|---|
| 2024 | -- | $13,425 | $1,225 | $12,200 |
| 2023 | $590 | $13,425 | $1,225 | $12,200 |
| 2022 | $590 | $13,425 | $1,225 | $12,200 |
| 2021 | $590 | $13,425 | $1,225 | $12,200 |
| 2020 | $563 | $13,425 | $1,225 | $12,200 |
| 2019 | $563 | $11,900 | $1,225 | $10,675 |
| 2018 | $560 | $11,900 | $1,225 | $10,675 |
| 2017 | $560 | $11,900 | $1,225 | $10,675 |
| 2016 | $684 | $14,175 | $1,225 | $12,950 |
| 2014 | $646 | $14,174 | $0 | $0 |
Source: Public Records
Map
Nearby Homes
- 751 Jackson St
- 1500 Georgia Ave
- 1462 Georgia Ave
- 1615 Maryland Ave
- 1304 Virginia Ave
- 1241 Virginia Ave
- 1237 Virginia Ave
- 1430 E Cedar St
- 1021 Georgia Ave
- 1021 Georgia Ave Unit 1
- 1319 5th St
- 1132 1/2 Virginia Ave
- 1013 Kentucky Ave
- 224 Leslie Ct
- 109 Penrod Rd
- 917 Pennsylvania Ave
- 105 Pemberton Ct
- 920 Pennsylvania Ave
- 311 Leslie Ct
- 308 Cardinal Ln
- 1550 Rock Rose Rd
- 1540 Rock Rose Rd
- 1556 Rock Rose Rd
- 1536 Rock Rose Rd
- 1533 Valley Dr
- 1532 Rock Rose Rd
- 1564 Rock Rose Rd
- 1525 Valley Dr
- 1525 Valley Dr Unit 1
- 1539 Valley Dr
- 1519 Valley Dr
- 1528 Rock Rose Rd
- 1528 Rock Rose Rd Unit 1
- 1543 Valley Dr
- 1568 Rock Rose Rd
- 1517 Valley Dr
- 1524 Rock Rose Rd
- 1547 Valley Dr
- 229 N Paperville Rd
- 1513 Valley Dr