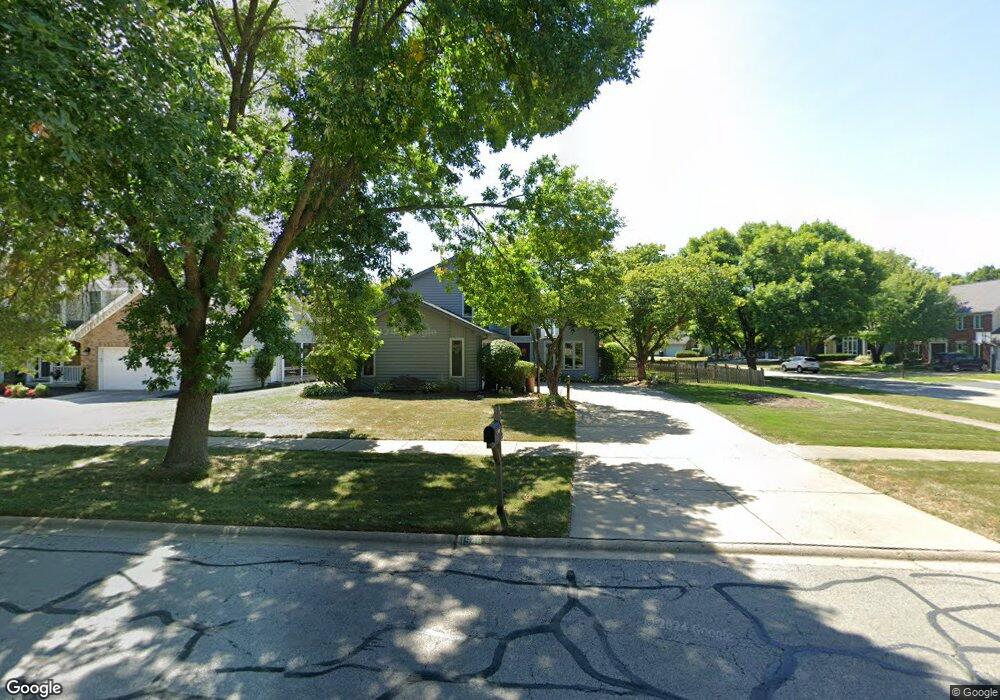
1548 Sequoia Rd Naperville, IL 60540
Watts NeighborhoodEstimated Value: $665,516 - $714,000
3
Beds
3
Baths
2,324
Sq Ft
$296/Sq Ft
Est. Value
About This Home
This home is located at 1548 Sequoia Rd, Naperville, IL 60540 and is currently estimated at $687,379, approximately $295 per square foot. 1548 Sequoia Rd is a home located in DuPage County with nearby schools including May Watts Elementary School, Thayer J. Hill Middle School, and Metea Valley High School.
Ownership History
Date
Name
Owned For
Owner Type
Purchase Details
Closed on
Mar 20, 2025
Sold by
Yedinak John
Bought by
Yedinak John A and Yedinak Jennifer M
Current Estimated Value
Purchase Details
Closed on
Dec 4, 2013
Sold by
Yedinak John and Yedinak Rhonda
Bought by
Yedinak John
Purchase Details
Closed on
Jun 30, 1998
Sold by
Shamie Sue
Bought by
Yedinak John A and Yedinak Rhonda
Home Financials for this Owner
Home Financials are based on the most recent Mortgage that was taken out on this home.
Original Mortgage
$226,980
Interest Rate
7.13%
Purchase Details
Closed on
Jul 19, 1995
Sold by
Shamie Barry S and Shamie Burford M
Bought by
Shamie Sue
Create a Home Valuation Report for This Property
The Home Valuation Report is an in-depth analysis detailing your home's value as well as a comparison with similar homes in the area
Home Values in the Area
Average Home Value in this Area
Purchase History
| Date | Buyer | Sale Price | Title Company |
|---|---|---|---|
| Yedinak John A | -- | None Listed On Document | |
| Yedinak John | -- | None Available | |
| Yedinak John A | $243,500 | First American Title | |
| Shamie Sue | -- | -- |
Source: Public Records
Mortgage History
| Date | Status | Borrower | Loan Amount |
|---|---|---|---|
| Previous Owner | Yedinak John A | $226,980 |
Source: Public Records
Tax History
| Year | Tax Paid | Tax Assessment Tax Assessment Total Assessment is a certain percentage of the fair market value that is determined by local assessors to be the total taxable value of land and additions on the property. | Land | Improvement |
|---|---|---|---|---|
| 2024 | $11,249 | $188,214 | $52,941 | $135,273 |
| 2023 | $10,773 | $169,120 | $47,570 | $121,550 |
| 2022 | $10,358 | $157,570 | $43,970 | $113,600 |
| 2021 | $10,032 | $151,950 | $42,400 | $109,550 |
| 2020 | $10,018 | $151,950 | $42,400 | $109,550 |
| 2019 | $9,624 | $144,520 | $40,330 | $104,190 |
| 2018 | $9,685 | $142,820 | $38,920 | $103,900 |
| 2017 | $9,419 | $137,980 | $37,600 | $100,380 |
| 2016 | $9,247 | $132,410 | $36,080 | $96,330 |
| 2015 | $9,161 | $125,720 | $34,260 | $91,460 |
| 2014 | $8,979 | $119,280 | $32,260 | $87,020 |
| 2013 | $8,959 | $120,100 | $32,480 | $87,620 |
Source: Public Records
Map
Nearby Homes
- 1927 Crossing Ct
- 2407 Orchid Ct
- 1161 Banyon Ct
- 2524 Carrolwood Rd Unit 25
- 625 Buttonwood Cir
- 1308 Stonegate Rd
- 2607 Lexington Ln Unit 4
- 421 Berry Dr
- 901 Heathrow Ln
- 332 S River Rd
- 7S410 Arbor Dr
- 319 Claremont Ct
- 1259 Natchez Trace Cir
- 417 River Bluff Cir
- 1099 W Jefferson Ave
- 1033 Emerald Dr
- 1225 Whispering Hills Ct Unit 3B
- 316 Hemlock Ln
- 511 Aurora Ave Unit 620
- 509 Aurora Ave Unit 120
- 1544 Sequoia Rd
- 1510 Ambleside Cir
- 1501 Ambleside Cir
- 1540 Sequoia Rd
- 1505 Ambleside Cir
- 1509 Ambleside Cir
- 1468 Ambleside Cir
- 1537 Meadowland Dr
- 1536 Sequoia Rd
- 631 Windridge Ct
- 1513 Ambleside Cir
- 1469 Ambleside Cir
- 1517 Ambleside Cir
- 1533 Meadowland Dr
- 1464 Ambleside Cir
- 1608 Sequoia Rd
- 712 Sanctuary Ln
- 708 Sanctuary Ln
- 627 Windridge Ct
- 1521 Ambleside Cir