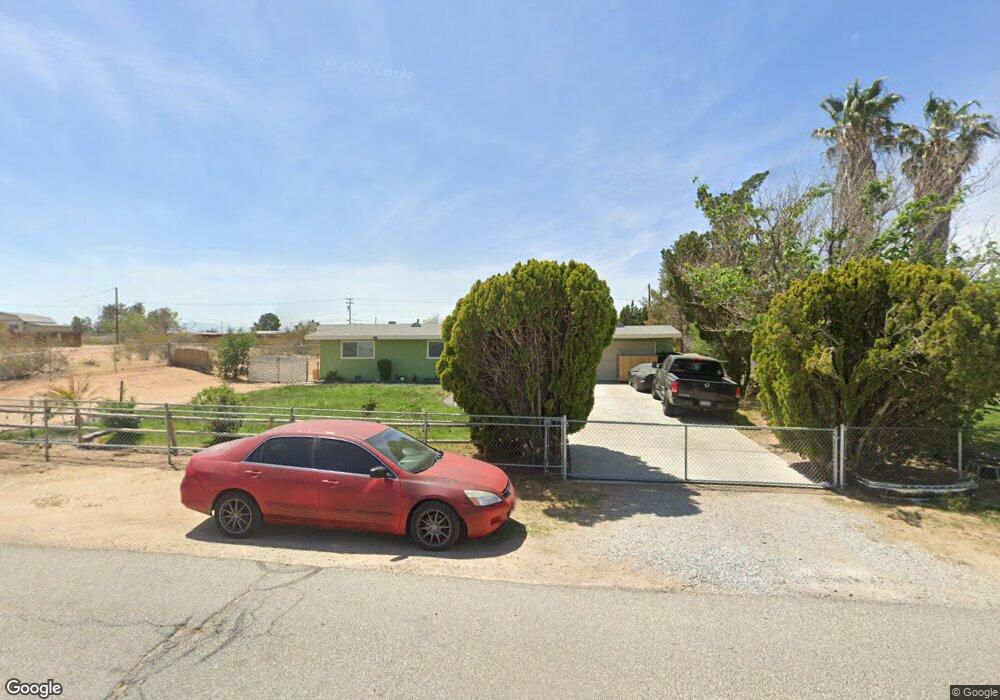
15490 Culebra Rd Victorville, CA 92394
Estimated Value: $293,000 - $383,000
3
Beds
2
Baths
1,111
Sq Ft
$306/Sq Ft
Est. Value
About This Home
This home is located at 15490 Culebra Rd, Victorville, CA 92394 and is currently estimated at $340,513, approximately $306 per square foot. 15490 Culebra Rd is a home located in San Bernardino County with nearby schools including Puesta Del Sol Elementary School, Village Elementary School, and Challenger School Of Sports And Fitness.
Ownership History
Date
Name
Owned For
Owner Type
Purchase Details
Closed on
Aug 3, 2012
Sold by
Pena Edward and Pena Falinda
Bought by
Briley Randy and Gonzalez Amanda
Current Estimated Value
Home Financials for this Owner
Home Financials are based on the most recent Mortgage that was taken out on this home.
Original Mortgage
$65,000
Outstanding Balance
$44,923
Interest Rate
3.62%
Mortgage Type
Purchase Money Mortgage
Estimated Equity
$295,590
Purchase Details
Closed on
Nov 29, 2011
Sold by
Pena Edward and Pena Falinda
Bought by
Pena Edward and Pena Falinda
Purchase Details
Closed on
Aug 16, 2011
Sold by
Pena Edward Gilbert and The Herminia Pena Separate Pro
Bought by
Pena Edward G
Purchase Details
Closed on
May 7, 2002
Sold by
Pena Herminia
Bought by
Pena Herminia and The Herminia Pena Separate Pro
Purchase Details
Closed on
Jan 30, 1995
Sold by
Pena Gilbert and Pena Herminia N
Bought by
Pena Herminia N and Pena Edward G
Create a Home Valuation Report for This Property
The Home Valuation Report is an in-depth analysis detailing your home's value as well as a comparison with similar homes in the area
Home Values in the Area
Average Home Value in this Area
Purchase History
| Date | Buyer | Sale Price | Title Company |
|---|---|---|---|
| Briley Randy | $65,000 | First American Title Company | |
| Pena Edward | -- | None Available | |
| Pena Edward | -- | None Available | |
| Pena Edward G | -- | None Available | |
| Pena Herminia | -- | -- | |
| Pena Herminia N | -- | -- |
Source: Public Records
Mortgage History
| Date | Status | Borrower | Loan Amount |
|---|---|---|---|
| Open | Briley Randy | $65,000 |
Source: Public Records
Tax History Compared to Growth
Tax History
| Year | Tax Paid | Tax Assessment Tax Assessment Total Assessment is a certain percentage of the fair market value that is determined by local assessors to be the total taxable value of land and additions on the property. | Land | Improvement |
|---|---|---|---|---|
| 2025 | $779 | $64,650 | $14,379 | $50,271 |
| 2024 | $779 | $63,382 | $14,097 | $49,285 |
| 2023 | $770 | $62,140 | $13,821 | $48,319 |
| 2022 | $755 | $60,922 | $13,550 | $47,372 |
| 2021 | $741 | $59,727 | $13,284 | $46,443 |
| 2020 | $727 | $59,115 | $13,148 | $45,967 |
| 2019 | $715 | $57,956 | $12,890 | $45,066 |
| 2018 | $761 | $56,819 | $12,637 | $44,182 |
| 2017 | $888 | $55,705 | $12,389 | $43,316 |
| 2016 | $731 | $54,613 | $12,146 | $42,467 |
| 2015 | $706 | $53,793 | $11,964 | $41,829 |
| 2014 | $692 | $52,740 | $11,730 | $41,010 |
Source: Public Records
Map
Nearby Homes
- 15801 Malpais Ln
- 15770 Mojave Dr
- 15337 Don Roberto Rd
- 15802 Malpais Ln
- 15720 Mojave Dr
- 15754 Tern Rd
- 15413 Burwood Rd
- 0 Sueno Ln Unit HD25230918
- 0 Jaypost Rd
- 15638 Burwood Rd
- 0 Village Dr Unit HD24046927
- 0 Village Dr Unit HD25097697
- 0 Village Dr Unit HD25004724
- 0 Village Dr Unit HD24234317
- 16134 Colina St
- 16079 Tawney Ridge Ln
- 16098 Tawney Ridge Ln
- 15084 Condor Rd
- 0 Barranca Way Unit PW25106825
- 0 Barranca Way Unit PW25106858
- 15504 Culebra Rd
- 15491 Condor Rd
- 15520 Culebra Rd
- 15507 Condor Rd
- 15477 Condor Rd
- 15464 Culebra Rd
- 15471 Culebra Rd
- 15515 Culebra Rd
- 15461 Condor Rd
- 15823 Calgo Ln
- 15445 Condor Rd
- 15428 Morada Rd
- 15451 Culebra Rd
- 15780 Calgo Ln
- 15418 Morada Rd
- 15762 Calgo Ln
- 15468 Morada Rd
- 15798 Calgo Ln
- 15492 Condor Rd
- 15508 Condor Rd