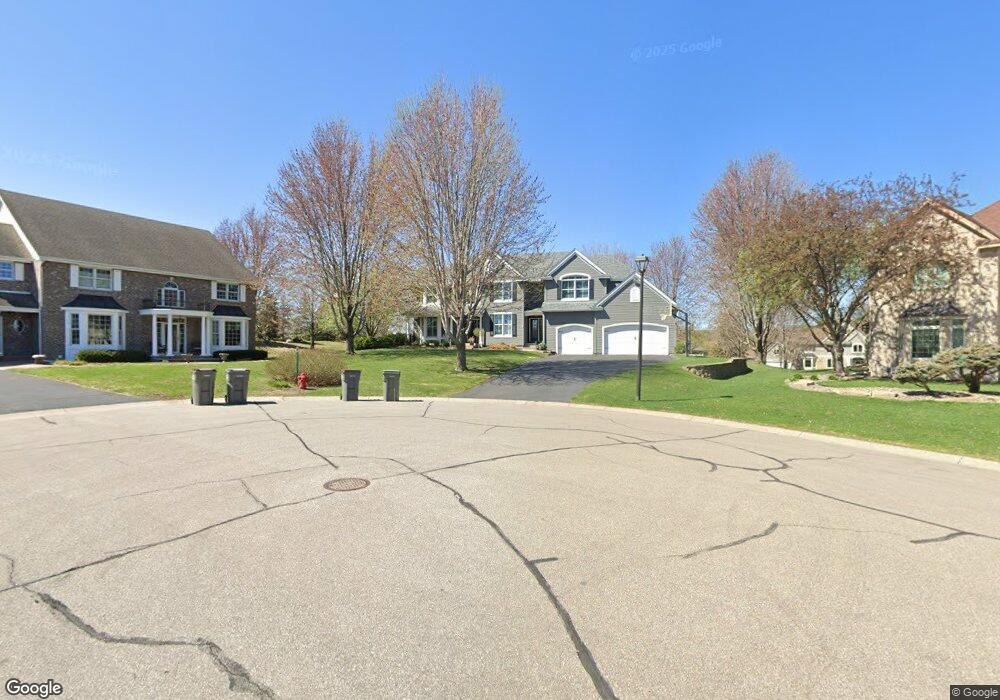
15496 Stanbury Curve Eden Prairie, MN 55347
Estimated Value: $1,067,000 - $1,350,755
5
Beds
4
Baths
4,080
Sq Ft
$295/Sq Ft
Est. Value
About This Home
This home is located at 15496 Stanbury Curve, Eden Prairie, MN 55347 and is currently estimated at $1,205,189, approximately $295 per square foot. 15496 Stanbury Curve is a home located in Hennepin County with nearby schools including Central Middle School, Eden Prairie High School, and Primrose School of Eden Prairie.
Ownership History
Date
Name
Owned For
Owner Type
Purchase Details
Closed on
Dec 30, 2022
Sold by
Randle Kori and Randle John Warren
Bought by
Duncan Donald Joseph and Duncan Trisha
Current Estimated Value
Home Financials for this Owner
Home Financials are based on the most recent Mortgage that was taken out on this home.
Original Mortgage
$980,000
Outstanding Balance
$949,080
Interest Rate
6.49%
Mortgage Type
New Conventional
Estimated Equity
$256,109
Purchase Details
Closed on
Sep 13, 2013
Sold by
Brooke Robert W and Brooke Helen R
Bought by
Randle John Warren and Randle Kori
Home Financials for this Owner
Home Financials are based on the most recent Mortgage that was taken out on this home.
Original Mortgage
$646,000
Interest Rate
3.75%
Mortgage Type
Adjustable Rate Mortgage/ARM
Purchase Details
Closed on
Aug 2, 1995
Sold by
Lundgren Bros Co
Bought by
Brooke Robert W and Brooke Helen R
Create a Home Valuation Report for This Property
The Home Valuation Report is an in-depth analysis detailing your home's value as well as a comparison with similar homes in the area
Home Values in the Area
Average Home Value in this Area
Purchase History
| Date | Buyer | Sale Price | Title Company |
|---|---|---|---|
| Duncan Donald Joseph | $1,232,864 | Edina Realty Title | |
| Randle John Warren | $807,500 | Multiple | |
| Brooke Robert W | $503,210 | -- |
Source: Public Records
Mortgage History
| Date | Status | Borrower | Loan Amount |
|---|---|---|---|
| Open | Duncan Donald Joseph | $980,000 | |
| Previous Owner | Randle John Warren | $646,000 | |
| Previous Owner | Randle John Warren | $80,700 |
Source: Public Records
Tax History Compared to Growth
Tax History
| Year | Tax Paid | Tax Assessment Tax Assessment Total Assessment is a certain percentage of the fair market value that is determined by local assessors to be the total taxable value of land and additions on the property. | Land | Improvement |
|---|---|---|---|---|
| 2024 | $13,115 | $995,900 | $246,100 | $749,800 |
| 2023 | $10,840 | $882,100 | $230,000 | $652,100 |
| 2022 | $9,272 | $858,200 | $223,700 | $634,500 |
| 2021 | $9,207 | $709,800 | $185,000 | $524,800 |
| 2020 | $9,853 | $709,800 | $185,000 | $524,800 |
| 2019 | $9,975 | $731,700 | $183,000 | $548,700 |
| 2018 | $9,863 | $731,700 | $183,000 | $548,700 |
| 2017 | $9,855 | $689,800 | $172,600 | $517,200 |
| 2016 | $10,335 | $725,500 | $181,500 | $544,000 |
| 2015 | $10,759 | $725,500 | $157,600 | $567,900 |
| 2014 | -- | $678,100 | $147,300 | $530,800 |
Source: Public Records
Map
Nearby Homes
- 15091 Amur Hill Ln
- 9030x W Staring Ln
- 9030 W Staring Ln
- 14773 Langdon Place
- 8945 Hilloway Rd
- 8991 Ferndale Ln
- 8956 Garland Ct
- 8855 Sylvan Ridge
- 16597 Kenning Rd
- 16344 Millford Dr
- 14364 Westridge Dr
- 14258 Towers Ln
- 14216 Towers Ln
- 14396 Sorrel Way
- 15729 Porchlight Ln
- 16957 Valley Rd
- 17027 Candlewood Pkwy
- 8868 Knollwood Dr
- 16996 Hanover Ln
- 16302 Sohm Ct
- 15496 Stanburry Curve
- 15501 Stanbury Curve
- 15468 Stanbury Curve
- 15468 Stanburry Curve
- 15548 Boulder Pointe Rd
- 15560 Boulder Pointe Rd
- 15524 Boulder Pointe Rd
- 15536 Boulder Pointe Rd
- 15440 Stanbury Curve
- 15473 Stanbury Curve
- 15445 Stanbury Curve
- 15512 Boulder Pointe Rd
- 15388 W Sunrise Cir
- 15417 Stanburry Curve
- 15552 Sweetwater Cir
- 15547 Sweetwater Cir
- 15412 Stanbury Curve
- 15412 Stanburry Curve
- 15366 W Sunrise Cir
- 15417 Stanbury Curve