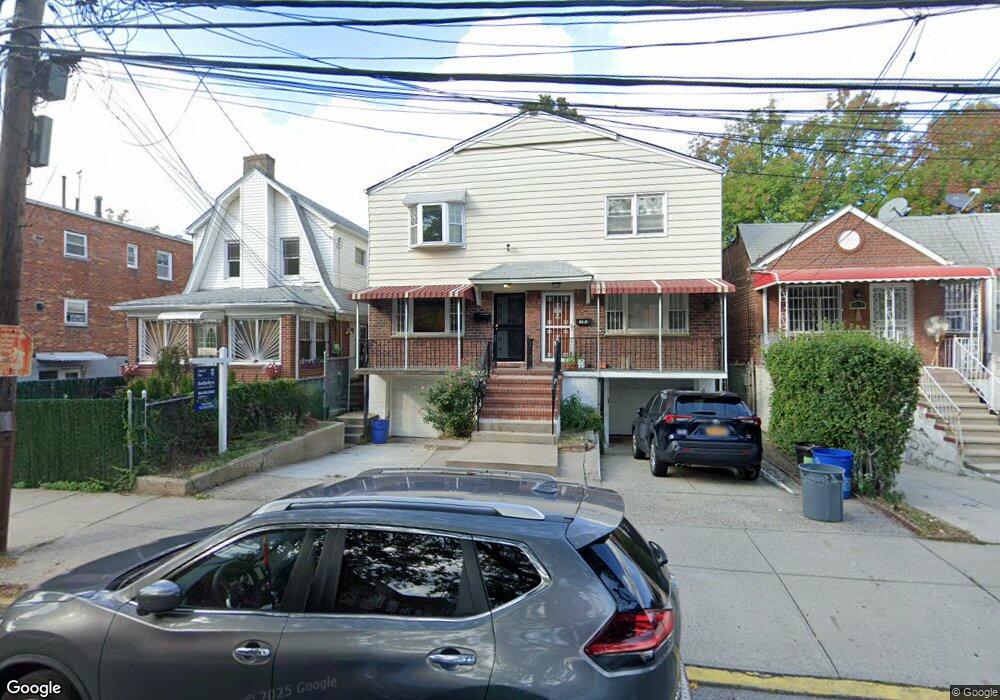
155-09 65th Ave Unit 1FL Flushing, NY 11367
Pomonok NeighborhoodEstimated Value: $839,000 - $1,005,000
2
Beds
1
Bath
1,258
Sq Ft
$737/Sq Ft
Est. Value
About This Home
This home is located at 155-09 65th Ave Unit 1FL, Flushing, NY 11367 and is currently estimated at $926,976, approximately $736 per square foot. 155-09 65th Ave Unit 1FL is a home located in Queens County with nearby schools including P.S. 201 - The Discovery School for Inquiry & Research, Rachel Carson I.S. 237Q, and The Lowell School.
Ownership History
Date
Name
Owned For
Owner Type
Purchase Details
Closed on
Feb 23, 2022
Sold by
Estate Of Robert J Glennon and Glennon
Bought by
Zhou Yang
Current Estimated Value
Home Financials for this Owner
Home Financials are based on the most recent Mortgage that was taken out on this home.
Original Mortgage
$300,000
Outstanding Balance
$279,289
Interest Rate
3.92%
Mortgage Type
Purchase Money Mortgage
Estimated Equity
$647,687
Purchase Details
Closed on
Jun 16, 2008
Sold by
Loguercio Andrew R
Bought by
Glennon Robert J and Glennon Robert J
Home Financials for this Owner
Home Financials are based on the most recent Mortgage that was taken out on this home.
Original Mortgage
$313,350
Interest Rate
6.07%
Mortgage Type
Purchase Money Mortgage
Purchase Details
Closed on
Feb 9, 2008
Sold by
Estate Of Michael Girardi and Davidow Davidow Siegel %
Bought by
Loguercio Andrew R Mr
Create a Home Valuation Report for This Property
The Home Valuation Report is an in-depth analysis detailing your home's value as well as a comparison with similar homes in the area
Home Values in the Area
Average Home Value in this Area
Purchase History
| Date | Buyer | Sale Price | Title Company |
|---|---|---|---|
| Zhou Yang | $820,000 | -- | |
| Zhou Yang | $820,000 | -- | |
| Glennon Robert J | $325,000 | -- | |
| Glennon Robert J | $325,000 | -- | |
| Loguercio Andrew R Mr | -- | -- | |
| Loguercio Andrew R Mr | -- | -- |
Source: Public Records
Mortgage History
| Date | Status | Borrower | Loan Amount |
|---|---|---|---|
| Open | Zhou Yang | $300,000 | |
| Closed | Zhou Yang | $300,000 | |
| Previous Owner | Glennon Robert J | $313,350 |
Source: Public Records
Tax History
| Year | Tax Paid | Tax Assessment Tax Assessment Total Assessment is a certain percentage of the fair market value that is determined by local assessors to be the total taxable value of land and additions on the property. | Land | Improvement |
|---|---|---|---|---|
| 2025 | $7,952 | $39,592 | $10,184 | $29,408 |
| 2024 | $6,455 | $39,590 | $10,765 | $28,825 |
| 2023 | $7,891 | $39,290 | $10,681 | $28,609 |
| 2022 | $5,616 | $51,960 | $13,440 | $38,520 |
| 2021 | $7,064 | $55,560 | $13,440 | $42,120 |
| 2020 | $6,688 | $53,340 | $13,440 | $39,900 |
| 2019 | $6,609 | $50,220 | $13,440 | $36,780 |
| 2018 | $6,377 | $32,742 | $10,144 | $22,598 |
| 2017 | $5,997 | $30,890 | $10,057 | $20,833 |
| 2016 | $5,516 | $30,890 | $10,057 | $20,833 |
| 2015 | $3,295 | $27,494 | $10,565 | $16,929 |
| 2014 | $3,295 | $27,494 | $10,832 | $16,662 |
Source: Public Records
Map
Nearby Homes
- 6126 160th St
- 5944 159th St
- 153-51 Horace Harding Expy
- 59-09 Kissena Blvd
- 152-72 Melbourne Ave Unit 1D
- 152-72 Melbourne Ave Unit LOB-E
- 15272 Melbourne Ave Unit 1B
- 152-56 Melbourne Ave Unit 246A
- 159-08 59th Ave
- 69-28 Kissena Blvd Unit 130B
- 15308 58th Rd
- 150-40 60th Ave
- 152-63 Jewel Ave Unit 1FL
- 67-08 152nd St Unit 266B
- 150-54 Melbourne Ave Unit 257A
- 152-47 Jewel Ave Unit 159B
- 150-62 Melbourne Ave Unit 261B
- 67-45 152nd St Unit 199A
- 150-48 Melbourne Ave Unit 254B
- 15223 Jewel Ave Unit 171B
- 155-09 65th Ave
- 15509 65th Ave
- 15511 65th Ave
- 15507 65th Ave
- 155-13 65 Ave
- 15513 65th Ave
- 155-13 65th Ave Unit 1st Fl
- 155-13 65th Ave Unit 2
- 155-13 65th Ave
- 15515 65th Ave
- 6415 155th St
- 6419 155th St
- 6415 155th St
- 155-17 65th Ave Unit 1
- 15517 65th Ave
- 155-17 65th Ave
- 155-17 65th Ave Unit Lower
- 15517 65th Ave Unit 1F
- 155-15 65th Ave
- 6409 155th St
Your Personal Tour Guide
Ask me questions while you tour the home.