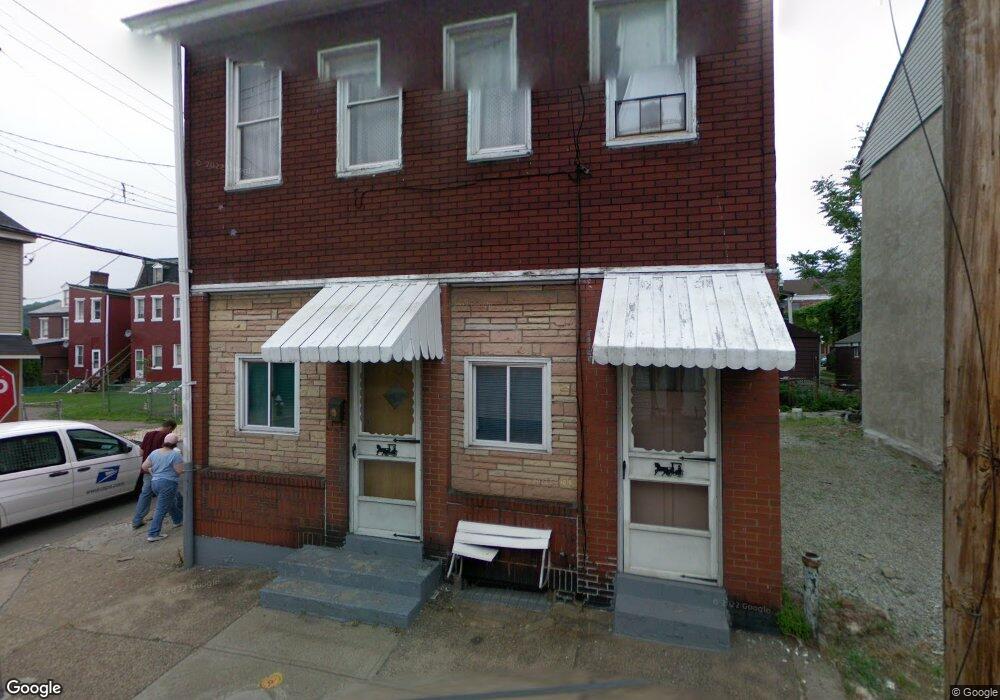
155 42nd St Pittsburgh, PA 15201
Central Lawrenceville NeighborhoodEstimated Value: $368,000 - $541,000
3
Beds
2
Baths
2,160
Sq Ft
$228/Sq Ft
Est. Value
About This Home
This home is located at 155 42nd St, Pittsburgh, PA 15201 and is currently estimated at $491,767, approximately $227 per square foot. 155 42nd St is a home located in Allegheny County with nearby schools including Pittsburgh Arsenal 6-8, Pittsburgh Arsenal K-5, and Pittsburgh Milliones 6-12.
Ownership History
Date
Name
Owned For
Owner Type
Purchase Details
Closed on
May 24, 2023
Sold by
Trombetta Kenneth V
Bought by
Trombetta Living Trust
Current Estimated Value
Purchase Details
Closed on
Feb 7, 2020
Sold by
Trombetta Kenneth V and Trombetta Mary Lou
Bought by
Trombetta Kenneth V and Trombetta Kenneth A
Purchase Details
Closed on
Apr 1, 2016
Sold by
Peterson Carol
Bought by
Trombetta Kenneth V and Trombetta Mary Lou
Create a Home Valuation Report for This Property
The Home Valuation Report is an in-depth analysis detailing your home's value as well as a comparison with similar homes in the area
Home Values in the Area
Average Home Value in this Area
Purchase History
| Date | Buyer | Sale Price | Title Company |
|---|---|---|---|
| Trombetta Living Trust | -- | -- | |
| Trombetta Living Trust | $1 | -- | |
| Trombetta Kenneth V | -- | None Available | |
| Trombetta Kenneth V | $205,000 | None Available |
Source: Public Records
Tax History Compared to Growth
Tax History
| Year | Tax Paid | Tax Assessment Tax Assessment Total Assessment is a certain percentage of the fair market value that is determined by local assessors to be the total taxable value of land and additions on the property. | Land | Improvement |
|---|---|---|---|---|
| 2025 | $5,163 | $224,100 | $25,600 | $198,500 |
| 2024 | $5,163 | $224,100 | $25,600 | $198,500 |
| 2023 | $5,163 | $224,100 | $25,600 | $198,500 |
| 2022 | $5,096 | $224,100 | $25,600 | $198,500 |
| 2021 | $5,152 | $224,100 | $25,600 | $198,500 |
| 2020 | $5,071 | $224,100 | $25,600 | $198,500 |
| 2019 | $5,071 | $224,100 | $25,600 | $198,500 |
| 2018 | $4,067 | $224,100 | $25,600 | $198,500 |
| 2017 | $2,028 | $89,600 | $25,600 | $64,000 |
| 2016 | $424 | $89,600 | $25,600 | $64,000 |
| 2015 | $424 | $89,600 | $25,600 | $64,000 |
| 2014 | $1,983 | $89,600 | $25,600 | $64,000 |
Source: Public Records
Map
Nearby Homes