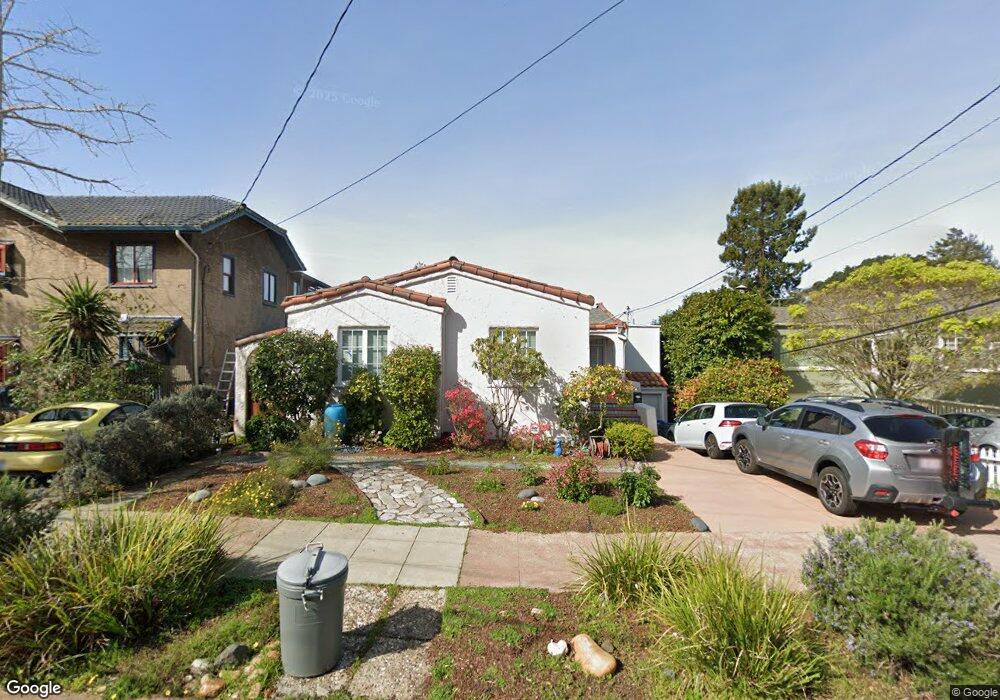
155 Ardmore Rd Kensington, CA 94707
Estimated Value: $1,319,000 - $1,600,000
2
Beds
2
Baths
1,715
Sq Ft
$832/Sq Ft
Est. Value
About This Home
This home is located at 155 Ardmore Rd, Kensington, CA 94707 and is currently estimated at $1,427,409, approximately $832 per square foot. 155 Ardmore Rd is a home located in Contra Costa County with nearby schools including Kensington Elementary School, Fred T. Korematsu Middle School, and El Cerrito Senior High School.
Ownership History
Date
Name
Owned For
Owner Type
Purchase Details
Closed on
Jan 24, 2025
Sold by
Anna Shane 2013 Trust and Shane Anna
Bought by
2015 Shiva Niazi And John Wind Family Trust and Wind
Current Estimated Value
Purchase Details
Closed on
Feb 3, 2016
Sold by
Wind John David and Niaza Shiva
Bought by
The 2015 Shiva Niazi & John Wind Family
Purchase Details
Closed on
Mar 4, 2008
Sold by
Oranje Nancy R and Utter Jean E
Bought by
Wind John David and Niazi Shiva
Home Financials for this Owner
Home Financials are based on the most recent Mortgage that was taken out on this home.
Original Mortgage
$595,200
Interest Rate
6.12%
Mortgage Type
Purchase Money Mortgage
Purchase Details
Closed on
Nov 9, 2000
Sold by
Utter Ivan R
Bought by
Utter Ivan R
Create a Home Valuation Report for This Property
The Home Valuation Report is an in-depth analysis detailing your home's value as well as a comparison with similar homes in the area
Home Values in the Area
Average Home Value in this Area
Purchase History
| Date | Buyer | Sale Price | Title Company |
|---|---|---|---|
| 2015 Shiva Niazi And John Wind Family Trust | -- | None Listed On Document | |
| The 2015 Shiva Niazi & John Wind Family | -- | None Available | |
| Wind John David | $744,000 | Chicago Title Company | |
| Utter Ivan R | -- | -- |
Source: Public Records
Mortgage History
| Date | Status | Borrower | Loan Amount |
|---|---|---|---|
| Previous Owner | Wind John David | $595,200 |
Source: Public Records
Tax History Compared to Growth
Tax History
| Year | Tax Paid | Tax Assessment Tax Assessment Total Assessment is a certain percentage of the fair market value that is determined by local assessors to be the total taxable value of land and additions on the property. | Land | Improvement |
|---|---|---|---|---|
| 2025 | $14,072 | $977,242 | $774,969 | $202,273 |
| 2024 | $13,811 | $958,081 | $759,774 | $198,307 |
| 2023 | $13,811 | $939,296 | $744,877 | $194,419 |
| 2022 | $13,613 | $920,879 | $730,272 | $190,607 |
| 2021 | $13,560 | $902,823 | $715,953 | $186,870 |
| 2019 | $12,746 | $876,046 | $694,718 | $181,328 |
| 2018 | $12,312 | $858,870 | $681,097 | $177,773 |
| 2017 | $12,114 | $842,031 | $667,743 | $174,288 |
| 2016 | $12,073 | $825,521 | $654,650 | $170,871 |
| 2015 | $12,114 | $813,122 | $644,817 | $168,305 |
| 2014 | $11,332 | $750,000 | $594,760 | $155,240 |
Source: Public Records
Map
Nearby Homes
- 716 Coventry Rd
- 700 Coventry Rd
- 201 Amherst Ave
- 380 Vermont Ave
- 581 Arlington Ave
- 139 Arlington Ave
- 566 The Alameda
- 1922 San Antonio Ave
- 479 Vermont Ave
- 267 Columbia Ave
- 1951 San Antonio Ave
- 411 Vassar Ave
- 1510 Valley Rd
- 479 Kentucky Ave
- 545 Colusa Ave
- 265 Willamette Ave
- 1998 San Antonio Ave
- 45 Alta Rd
- 135 Purdue Ave
- 1 Dewey Rd
- 161 Ardmore Rd
- 151 Ardmore Rd
- 149 Ardmore Rd
- 165 Ardmore Rd
- 719 Coventry Rd
- 145 Ardmore Rd
- 721 Coventry Rd Unit 1
- 721 Coventry Rd
- 169 Ardmore Rd
- 156 Ardmore Rd
- 162 Ardmore Rd
- 139 Ardmore Rd
- 715 Coventry Rd
- 725 Coventry Rd
- 166 Ardmore Rd
- 173 Ardmore Rd
- 150 Ardmore Rd
- 137 Ardmore Rd
- 2 Ardmore Path
- 146 Ardmore Rd