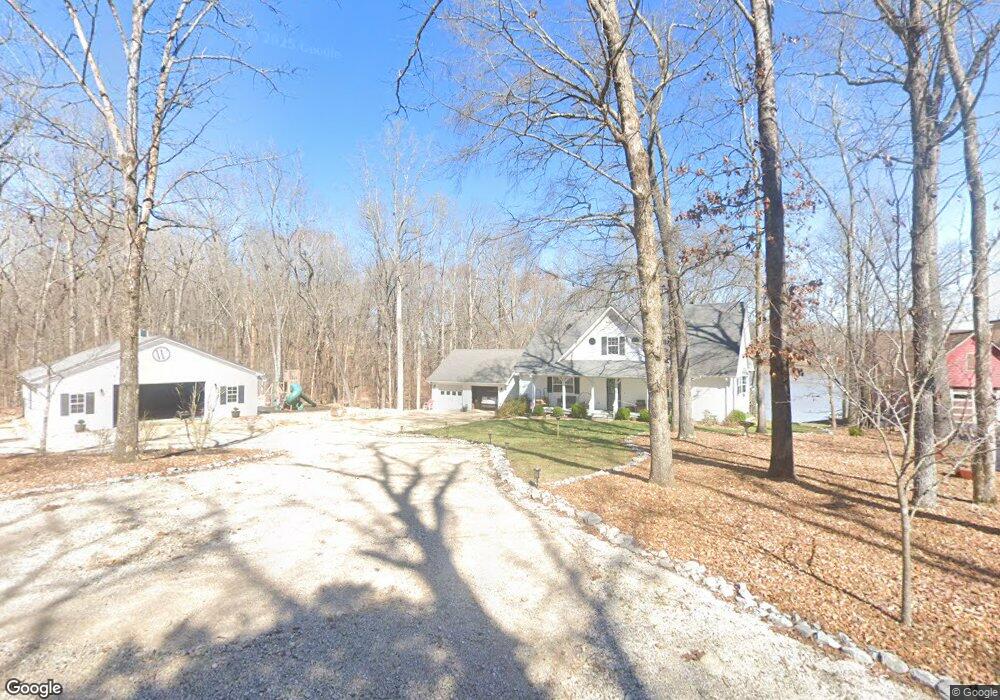
155 Argyle Rd Camden, TN 38320
Estimated Value: $523,847 - $743,000
4
Beds
3
Baths
3,588
Sq Ft
$189/Sq Ft
Est. Value
About This Home
This home is located at 155 Argyle Rd, Camden, TN 38320 and is currently estimated at $676,962, approximately $188 per square foot. 155 Argyle Rd is a home located in Benton County with nearby schools including Camden Elementary School, Briarwood School, and Camden Junior High School.
Ownership History
Date
Name
Owned For
Owner Type
Purchase Details
Closed on
Mar 3, 2015
Sold by
Etvir Wroblewski Lynn S
Bought by
Wroblewski Lynn S
Current Estimated Value
Purchase Details
Closed on
Oct 1, 2012
Sold by
Willis Jimmy R
Bought by
Wroblewski Lynn S and Wroblewski John J
Home Financials for this Owner
Home Financials are based on the most recent Mortgage that was taken out on this home.
Original Mortgage
$247,920
Interest Rate
4.37%
Mortgage Type
Cash
Purchase Details
Closed on
Mar 17, 2003
Bought by
Willis Jimmy R
Purchase Details
Closed on
Aug 27, 2001
Bought by
Wastel Steven R and Wastel Kathleen D
Purchase Details
Closed on
Dec 28, 1998
Bought by
Voss Monty D Judith G
Purchase Details
Closed on
Jul 28, 1995
Sold by
Doty James W
Bought by
Youngbluth William O
Purchase Details
Closed on
Sep 7, 1971
Bought by
Doty James W and Doty Raymond K
Create a Home Valuation Report for This Property
The Home Valuation Report is an in-depth analysis detailing your home's value as well as a comparison with similar homes in the area
Purchase History
| Date | Buyer | Sale Price | Title Company |
|---|---|---|---|
| Wroblewski Lynn S | -- | -- | |
| Wroblewski Lynn S | -- | -- | |
| Wroblewski Lynn S | $309,900 | -- | |
| Willis Jimmy R | $253,000 | -- | |
| Wastel Steven R | $215,000 | -- | |
| Voss Monty D Judith G | $198,000 | -- | |
| Youngbluth William O | $30,000 | -- | |
| Doty James W | -- | -- |
Source: Public Records
Mortgage History
| Date | Status | Borrower | Loan Amount |
|---|---|---|---|
| Previous Owner | Wroblewski Lynn S | $247,920 |
Source: Public Records
Tax History
| Year | Tax Paid | Tax Assessment Tax Assessment Total Assessment is a certain percentage of the fair market value that is determined by local assessors to be the total taxable value of land and additions on the property. | Land | Improvement |
|---|---|---|---|---|
| 2025 | $2,282 | $133,700 | $35,650 | $98,050 |
| 2024 | $2,393 | $87,750 | $37,500 | $50,250 |
| 2023 | $2,393 | $87,750 | $37,500 | $50,250 |
| 2022 | $2,393 | $87,750 | $37,500 | $50,250 |
| 2021 | $2,393 | $87,750 | $37,500 | $50,250 |
| 2020 | $2,396 | $87,750 | $37,500 | $50,250 |
| 2019 | $2,242 | $76,000 | $31,250 | $44,750 |
| 2018 | $2,242 | $76,000 | $31,250 | $44,750 |
| 2017 | $2,242 | $76,000 | $31,250 | $44,750 |
| 2016 | $2,193 | $74,325 | $31,250 | $43,075 |
| 2015 | $2,222 | $74,325 | $31,250 | $43,075 |
| 2014 | -- | $74,325 | $31,250 | $43,075 |
| 2013 | -- | $60,352 | $0 | $0 |
Source: Public Records
Map
Nearby Homes
- 199 Argyle Rd
- 000 Clydesdale Rd
- 162 Stirling Rd
- 150 Beaverdam Cabin Rd
- 844 Stirling Rd
- 844 Stirling Rd Unit 14,15
- Lot 10 Beaverdam Cabin Rd
- 44 G and S Rock Ranch Rd
- 696 Stirling Rd
- 0 Stirling Rd Unit RTC3038984
- 96 Quail Ln
- 50 Dingus Ln
- 100 Camelot Dr
- 45 Camelot Dr
- 000 Saddletree Rd
- 0 Eva Harbor Rd
- 54 Shetland Cir
- 979 Highlander Rd
- 000 Elgin Rd
- 00 Cummins Rd Eva Harbor Rd
- 165 Argyle Rd
- 165
- 175 Argyle Rd
- 187 Argyle Rd
- 199 Argyll Rd
- 197 Argyle Rd
- 100 Argyle Rd
- 450 Stirling Rd
- 345 Stirling Rd
- 460 Stirling Rd
- 345 Stirling Rd (Water View)
- 445 Stirling Rd
- 55 Argyle Rd
- 60 Argyle Rd
- 475 Stirling Rd
- 484 Stirling Rd
- 290 Kinnaird Rd
- 495 Stirling Rd
- 305 Kinnaird Rd
- 500 Stirling Rd
Your Personal Tour Guide
Ask me questions while you tour the home.