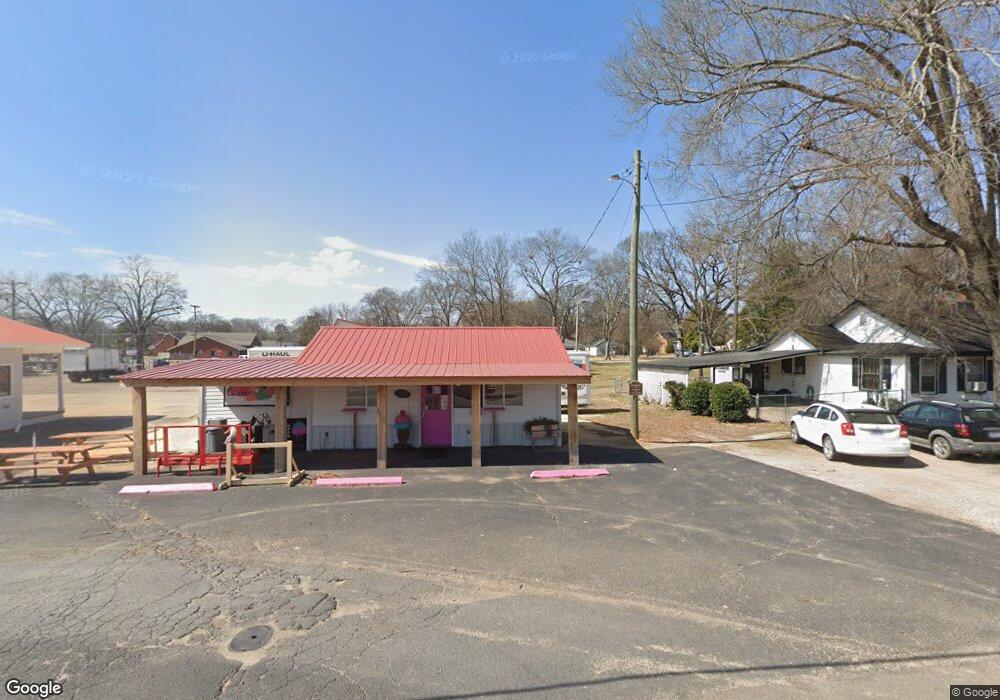
155 Cravens Dr Savannah, TN 38372
Estimated Value: $47,078 - $159,000
--
Bed
1
Bath
461
Sq Ft
$212/Sq Ft
Est. Value
About This Home
This home is located at 155 Cravens Dr, Savannah, TN 38372 and is currently estimated at $97,770, approximately $212 per square foot. 155 Cravens Dr is a home with nearby schools including Hardin County High School and Hardin County Christian School.
Ownership History
Date
Name
Owned For
Owner Type
Purchase Details
Closed on
Aug 23, 2021
Sold by
Haskins Micael Eugene and Haskins Norman Christine
Bought by
Renfroe Jason
Current Estimated Value
Home Financials for this Owner
Home Financials are based on the most recent Mortgage that was taken out on this home.
Original Mortgage
$182,000
Outstanding Balance
$35,370
Interest Rate
2.9%
Mortgage Type
Purchase Money Mortgage
Estimated Equity
$62,401
Purchase Details
Closed on
Mar 27, 2009
Sold by
Burdine Prentiss
Bought by
Haskins Micael E
Purchase Details
Closed on
Aug 3, 2004
Bought by
Burdine Prentiss and Burdine Cheryl
Home Financials for this Owner
Home Financials are based on the most recent Mortgage that was taken out on this home.
Original Mortgage
$10,000
Interest Rate
5.96%
Purchase Details
Closed on
Jun 14, 1991
Bought by
Love John Lewis & Nancy Carolyn Love
Purchase Details
Closed on
Oct 30, 1984
Bought by
Wood Robert Murry
Create a Home Valuation Report for This Property
The Home Valuation Report is an in-depth analysis detailing your home's value as well as a comparison with similar homes in the area
Home Values in the Area
Average Home Value in this Area
Purchase History
| Date | Buyer | Sale Price | Title Company |
|---|---|---|---|
| Renfroe Jason | $160,000 | None Available | |
| Haskins Micael E | $12,500 | -- | |
| Burdine Prentiss | $10,000 | -- | |
| Love John Lewis & Nancy Carolyn Love | $18,500 | -- | |
| Wood Robert Murry | -- | -- |
Source: Public Records
Mortgage History
| Date | Status | Borrower | Loan Amount |
|---|---|---|---|
| Open | Renfroe Jason | $182,000 | |
| Previous Owner | Wood Robert Murry | $10,000 |
Source: Public Records
Tax History Compared to Growth
Tax History
| Year | Tax Paid | Tax Assessment Tax Assessment Total Assessment is a certain percentage of the fair market value that is determined by local assessors to be the total taxable value of land and additions on the property. | Land | Improvement |
|---|---|---|---|---|
| 2024 | $151 | $6,160 | $2,000 | $4,160 |
| 2023 | $151 | $6,160 | $2,000 | $4,160 |
| 2022 | $145 | $5,240 | $1,800 | $3,440 |
| 2021 | $145 | $5,240 | $1,800 | $3,440 |
| 2020 | $145 | $5,240 | $1,800 | $3,440 |
| 2019 | $145 | $5,240 | $1,800 | $3,440 |
| 2018 | $141 | $5,240 | $1,800 | $3,440 |
| 2017 | $136 | $4,880 | $1,800 | $3,080 |
| 2016 | $136 | $4,880 | $1,800 | $3,080 |
| 2015 | $123 | $4,880 | $1,800 | $3,080 |
| 2014 | $123 | $4,880 | $1,800 | $3,080 |
Source: Public Records
Map
Nearby Homes
- 417 Tennessee St
- 375 Tennessee St
- 45 Oak St
- 171 White St
- 230 White St
- 10 Deberry St
- 50 Melrose Cove
- 165 College St
- 13305 U S Highway 64
- 105 Pinhook Dr
- 0 Church St Unit 10189215
- 0 Hwy 128 Hwy Unit LotWP001 22873478
- 0 Hwy 128 Hwy Unit RTC2801964
- 0 Hwy 128 Hwy Unit 10143254
- 00 Enoch Blvd
- 300 Patterson Rd
- 65 Davis St
- 330 Patterson Rd
- 70 Yeiser Dr
- 100 Poplar St
- 145 Cravens Dr
- 145 Cravens Dr
- 175 Cravens Dr
- 230 Cumberland St
- 180 Cravens Dr
- 175 Cumberland St
- 195 Cravens Dr
- 504 Alabama St
- 205 Cravens Dr
- 15 Robertson St
- 165 Cumberland St
- 25 Robertson St
- 290 Alabama St
- 260 Alabama St
- 145 Cumberland St
- 235 Alabama St
- 265 Alabama St
- 10 Robertson St
- 135 Cumberland St
- 85 Cravens Dr