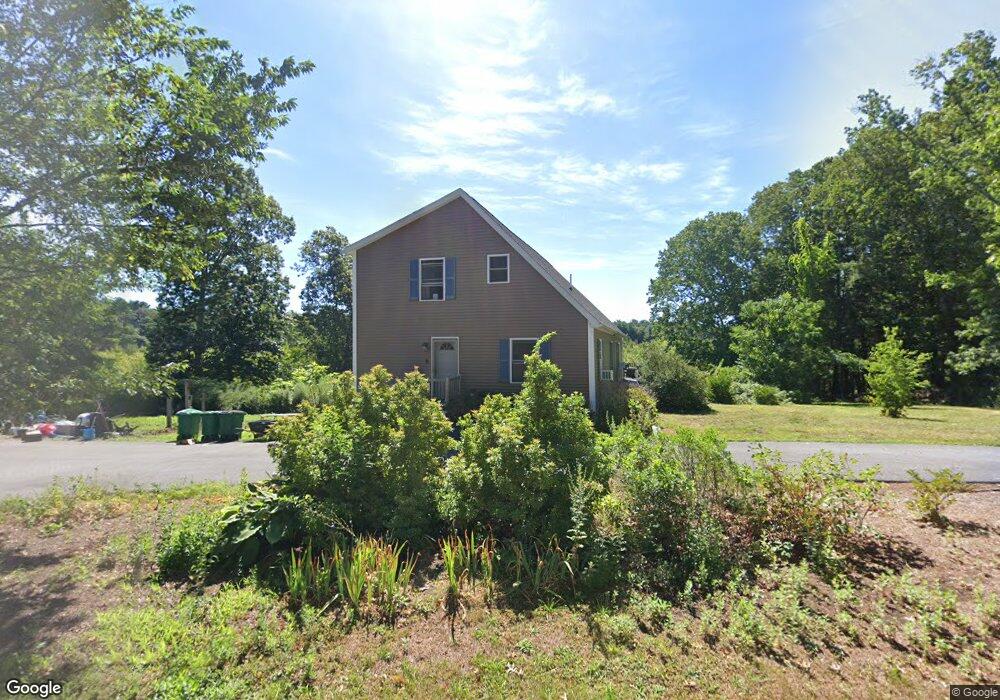
155 Elmer St Pembroke, MA 02359
Estimated Value: $600,000 - $757,000
--
Bed
--
Bath
2,093
Sq Ft
$341/Sq Ft
Est. Value
About This Home
This home is located at 155 Elmer St, Pembroke, MA 02359 and is currently estimated at $713,109, approximately $340 per square foot. 155 Elmer St is a home with nearby schools including Pembroke High School.
Ownership History
Date
Name
Owned For
Owner Type
Purchase Details
Closed on
Jun 24, 2020
Sold by
Cullity Lisa
Bought by
Cullity William and Cullity Lisa
Current Estimated Value
Home Financials for this Owner
Home Financials are based on the most recent Mortgage that was taken out on this home.
Original Mortgage
$322,000
Outstanding Balance
$225,848
Interest Rate
3.1%
Mortgage Type
New Conventional
Estimated Equity
$487,261
Purchase Details
Closed on
Feb 11, 2019
Sold by
Davis Arthur E and Morrisette Robrt
Bought by
Cullity Lisa
Purchase Details
Closed on
Jul 9, 2012
Sold by
Davis Arthur E and Morrisette Robert
Bought by
Cullity Lisa
Home Financials for this Owner
Home Financials are based on the most recent Mortgage that was taken out on this home.
Original Mortgage
$294,500
Interest Rate
3.78%
Mortgage Type
New Conventional
Create a Home Valuation Report for This Property
The Home Valuation Report is an in-depth analysis detailing your home's value as well as a comparison with similar homes in the area
Home Values in the Area
Average Home Value in this Area
Purchase History
| Date | Buyer | Sale Price | Title Company |
|---|---|---|---|
| Cullity William | -- | None Available | |
| Cullity Lisa | $310,000 | -- | |
| Cullity Lisa | $310,000 | -- | |
| Cullity Lisa | $310,000 | -- |
Source: Public Records
Mortgage History
| Date | Status | Borrower | Loan Amount |
|---|---|---|---|
| Open | Cullity William | $322,000 | |
| Previous Owner | Cullity Lisa | $294,500 |
Source: Public Records
Tax History Compared to Growth
Tax History
| Year | Tax Paid | Tax Assessment Tax Assessment Total Assessment is a certain percentage of the fair market value that is determined by local assessors to be the total taxable value of land and additions on the property. | Land | Improvement |
|---|---|---|---|---|
| 2025 | $7,494 | $623,500 | $280,100 | $343,400 |
| 2024 | $7,361 | $611,900 | $275,300 | $336,600 |
| 2023 | $7,360 | $578,600 | $275,300 | $303,300 |
| 2022 | $7,000 | $494,700 | $225,300 | $269,400 |
| 2021 | $6,781 | $465,100 | $214,900 | $250,200 |
| 2020 | $6,312 | $435,600 | $205,300 | $230,300 |
| 2019 | $6,164 | $422,200 | $200,100 | $222,100 |
| 2018 | $6,063 | $407,200 | $185,300 | $221,900 |
| 2017 | $6,007 | $397,800 | $175,300 | $222,500 |
| 2016 | $5,909 | $387,200 | $165,300 | $221,900 |
| 2015 | $5,483 | $372,000 | $150,100 | $221,900 |
Source: Public Records
Map
Nearby Homes