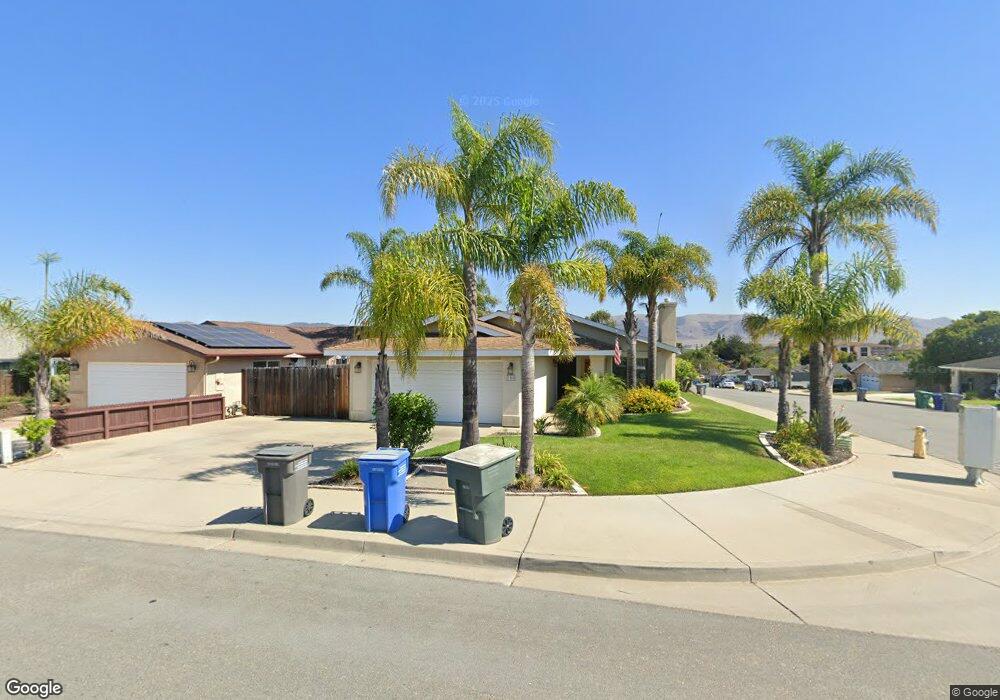
155 Elvira Way Nipomo, CA 93444
Estimated Value: $638,380 - $707,000
3
Beds
2
Baths
1,218
Sq Ft
$553/Sq Ft
Est. Value
About This Home
This home is located at 155 Elvira Way, Nipomo, CA 93444 and is currently estimated at $673,845, approximately $553 per square foot. 155 Elvira Way is a home located in San Luis Obispo County with nearby schools including Dana Elementary School, Mesa Middle School, and Nipomo High School.
Ownership History
Date
Name
Owned For
Owner Type
Purchase Details
Closed on
Apr 2, 1998
Sold by
The Exchange Group Inc
Bought by
Moldt Steven C and Moldt Stacy L
Current Estimated Value
Home Financials for this Owner
Home Financials are based on the most recent Mortgage that was taken out on this home.
Original Mortgage
$137,614
Interest Rate
6.89%
Mortgage Type
FHA
Create a Home Valuation Report for This Property
The Home Valuation Report is an in-depth analysis detailing your home's value as well as a comparison with similar homes in the area
Home Values in the Area
Average Home Value in this Area
Purchase History
| Date | Buyer | Sale Price | Title Company |
|---|---|---|---|
| Moldt Steven C | $139,500 | Fidelity National Title Co |
Source: Public Records
Mortgage History
| Date | Status | Borrower | Loan Amount |
|---|---|---|---|
| Previous Owner | Moldt Steven C | $137,614 |
Source: Public Records
Tax History Compared to Growth
Tax History
| Year | Tax Paid | Tax Assessment Tax Assessment Total Assessment is a certain percentage of the fair market value that is determined by local assessors to be the total taxable value of land and additions on the property. | Land | Improvement |
|---|---|---|---|---|
| 2025 | $2,303 | $222,197 | $94,049 | $128,148 |
| 2024 | $2,277 | $217,841 | $92,205 | $125,636 |
| 2023 | $2,277 | $213,571 | $90,398 | $123,173 |
| 2022 | $2,243 | $209,384 | $88,626 | $120,758 |
| 2021 | $2,239 | $205,280 | $86,889 | $118,391 |
| 2020 | $2,214 | $203,177 | $85,999 | $117,178 |
| 2019 | $2,200 | $199,194 | $84,313 | $114,881 |
| 2018 | $2,174 | $195,289 | $82,660 | $112,629 |
| 2017 | $2,134 | $191,461 | $81,040 | $110,421 |
| 2016 | $2,014 | $187,707 | $79,451 | $108,256 |
| 2015 | $1,985 | $184,888 | $78,258 | $106,630 |
| 2014 | $1,912 | $181,268 | $76,726 | $104,542 |
Source: Public Records
Map
Nearby Homes
- 719 W Tefft St
- 759 Viola Ct
- 680 Hill St
- Mesa Plan at Hill Street Terraces - Hill Street Series
- Pacific Plan at Hill Street Terraces - Hill Street Series
- Monarch Plan at Hill Street Terraces - Hill Street Series
- Rancho Plan at Hill Street Terraces - Hill Street Series
- Dana Plan at Hill Street Terraces - Hill Street Series
- 232 Scarlett Cir
- 217 Hope Way
- 219 Lema Dr
- 228 Chaparral Ln
- 483 Violet Ave
- 261 Hazel Ln
- 255 Encino Ln
- 875 Camino Caballo
- 522 Higos Way
- 368 Avenida de Amigos
- 626 Juno Ct
- 450 Avenida de Socios Unit 12
- 145 Elvira Way Unit LOT
- 145 Elvira Way
- 826 Tanis Place
- 139 Elvira Way
- 827 Tanis Place Unit LOT
- 827 Tanis Place
- 820 Tanis Place Unit LOT
- 820 Tanis Place
- 831 Tanis Place Unit LOT
- 831 Tanis Place
- 823 Tanis Place Unit LOT
- 823 Tanis Place
- 160 Elvira Way Unit LOT
- 160 Elvira Way
- 850 Derek Ct
- 150 Elvira Way Unit LOT
- 150 Elvira Way
- 833 Tanis Place Unit LOT
- 833 Tanis Place
- 817 Tanis Place Unit LOT