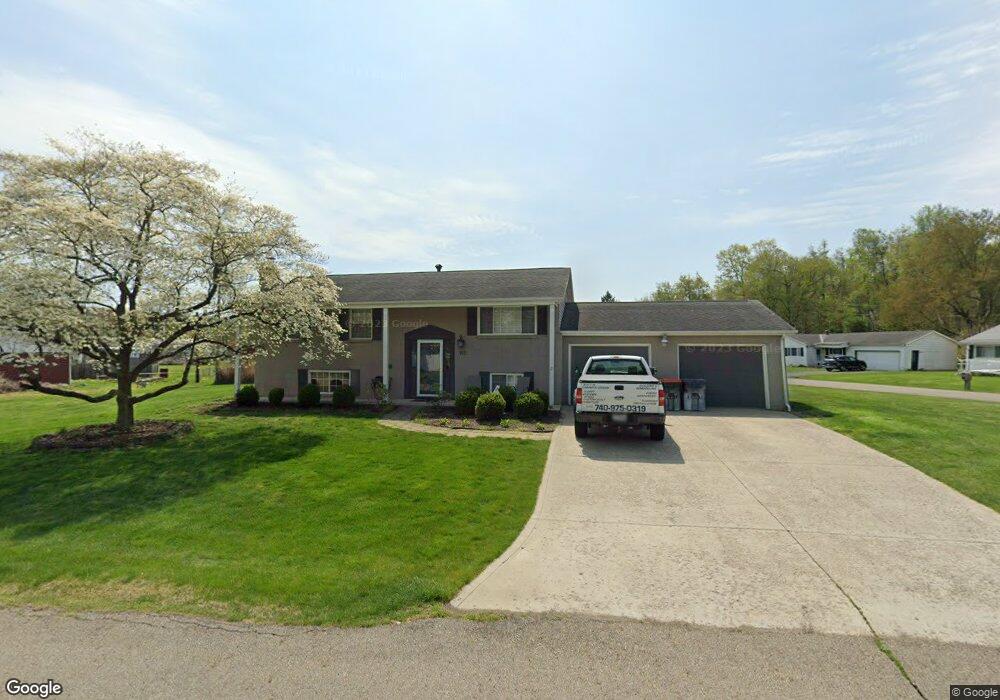
155 Flamingo Dr Newark, OH 43055
Estimated Value: $274,457 - $331,000
3
Beds
2
Baths
1,729
Sq Ft
$172/Sq Ft
Est. Value
About This Home
This home is located at 155 Flamingo Dr, Newark, OH 43055 and is currently estimated at $297,864, approximately $172 per square foot. 155 Flamingo Dr is a home located in Licking County with nearby schools including Utica High School.
Ownership History
Date
Name
Owned For
Owner Type
Purchase Details
Closed on
Jul 18, 2025
Sold by
Walker Shannon
Bought by
Walker Stephen M and Walker Shannon M
Current Estimated Value
Purchase Details
Closed on
Feb 12, 2024
Sold by
Cramer Living Trust
Bought by
Walker Shannon
Purchase Details
Closed on
Jan 26, 2017
Sold by
Cramer Jon W and Cramer Shirley M
Bought by
Walter Jon and Cramer Shirley Maxine
Purchase Details
Closed on
May 16, 2013
Sold by
Columbo Nellie J
Bought by
Cramer Jon W and Cramer Shirley M
Home Financials for this Owner
Home Financials are based on the most recent Mortgage that was taken out on this home.
Original Mortgage
$96,000
Interest Rate
3.39%
Mortgage Type
New Conventional
Purchase Details
Closed on
May 4, 2001
Sold by
Wohlheter Kelly C
Bought by
Columbo Nellie J
Home Financials for this Owner
Home Financials are based on the most recent Mortgage that was taken out on this home.
Original Mortgage
$77,200
Interest Rate
6.95%
Mortgage Type
New Conventional
Create a Home Valuation Report for This Property
The Home Valuation Report is an in-depth analysis detailing your home's value as well as a comparison with similar homes in the area
Home Values in the Area
Average Home Value in this Area
Purchase History
| Date | Buyer | Sale Price | Title Company |
|---|---|---|---|
| Walker Stephen M | -- | Monarch Title | |
| Walker Shannon | -- | None Listed On Document | |
| Walter Jon | -- | None Available | |
| Cramer Jon W | $120,000 | Bxohio Title | |
| Columbo Nellie J | $96,500 | -- |
Source: Public Records
Mortgage History
| Date | Status | Borrower | Loan Amount |
|---|---|---|---|
| Previous Owner | Cramer Jon W | $96,000 | |
| Previous Owner | Columbo Nellie J | $77,200 |
Source: Public Records
Tax History Compared to Growth
Tax History
| Year | Tax Paid | Tax Assessment Tax Assessment Total Assessment is a certain percentage of the fair market value that is determined by local assessors to be the total taxable value of land and additions on the property. | Land | Improvement |
|---|---|---|---|---|
| 2024 | $2,470 | $67,620 | $21,980 | $45,640 |
| 2023 | $2,472 | $67,620 | $21,980 | $45,640 |
| 2022 | $2,054 | $50,580 | $11,240 | $39,340 |
| 2021 | $2,097 | $50,580 | $11,240 | $39,340 |
| 2020 | $1,987 | $50,580 | $11,240 | $39,340 |
| 2019 | $1,690 | $40,120 | $8,650 | $31,470 |
| 2018 | $1,699 | $0 | $0 | $0 |
| 2017 | $1,643 | $0 | $0 | $0 |
| 2016 | $1,568 | $0 | $0 | $0 |
| 2015 | $1,554 | $0 | $0 | $0 |
| 2014 | $2,057 | $0 | $0 | $0 |
| 2013 | $1,150 | $0 | $0 | $0 |
Source: Public Records
Map
Nearby Homes
- 6434 Mount Vernon Rd
- 72 Parkway Dr
- 29 Parkway Dr
- 2360 E Audrey Dr
- 65 Sunset Dr
- Mt Vernon Rd Unit LotWP001
- 152 Lincoln Dr
- 2026 Freehold St
- 2012 Edison St
- 1952 Jamesburg St
- 1968 High Bridge St
- 1993 Iselin St
- 1981 Iselin St
- 1949 Iselin St
- 1957 Iselin St
- 1973 Iselin St
- 1977 Iselin St
- 1989 Iselin St
- 1948 Jamesburg St
- 1954 Iselin St