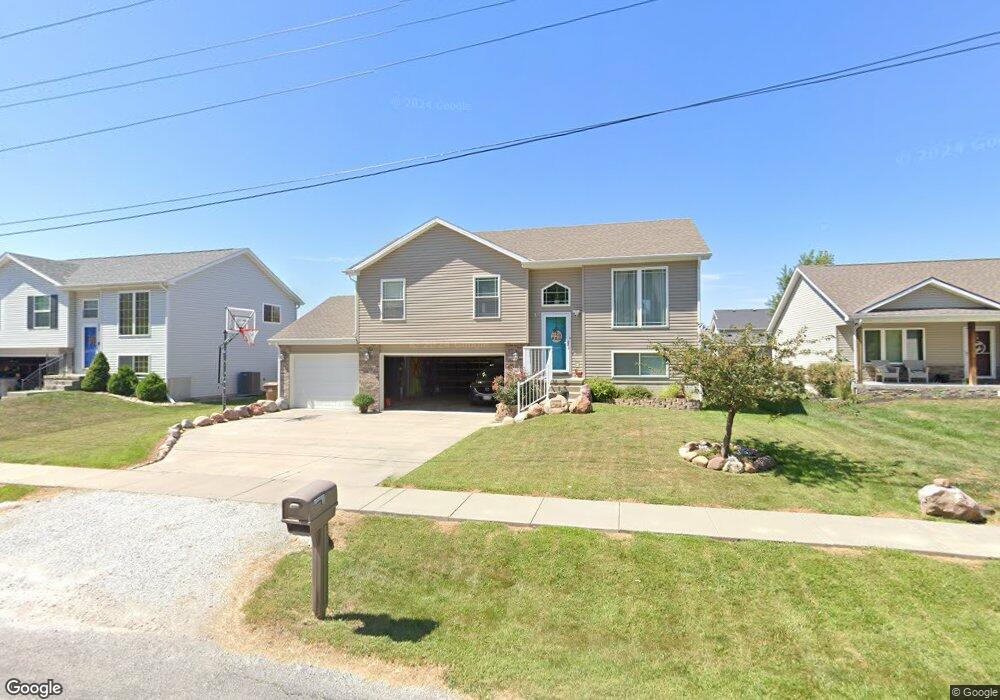
155 Jefferson St Bennet, NE 68317
Estimated Value: $274,000 - $319,000
3
Beds
2
Baths
1,564
Sq Ft
$191/Sq Ft
Est. Value
About This Home
This home is located at 155 Jefferson St, Bennet, NE 68317 and is currently estimated at $298,982, approximately $191 per square foot. 155 Jefferson St is a home located in Lancaster County with nearby schools including Elementary at Bennet and Junior/Senior High School at Palmyra.
Ownership History
Date
Name
Owned For
Owner Type
Purchase Details
Closed on
Mar 24, 2015
Sold by
Meyer Ryan W and Meyer Amanda R
Bought by
Ottmann Trevor J
Current Estimated Value
Home Financials for this Owner
Home Financials are based on the most recent Mortgage that was taken out on this home.
Original Mortgage
$135,204
Outstanding Balance
$103,785
Interest Rate
3.82%
Mortgage Type
New Conventional
Estimated Equity
$195,197
Purchase Details
Closed on
Jul 7, 2009
Sold by
Cherry Hill Homes Inc
Bought by
Meyer Ryan W
Home Financials for this Owner
Home Financials are based on the most recent Mortgage that was taken out on this home.
Original Mortgage
$135,531
Interest Rate
4.97%
Mortgage Type
FHA
Purchase Details
Closed on
Nov 26, 2007
Sold by
Bennet Ridge Llc
Bought by
Cherry Hill Homes Inc
Create a Home Valuation Report for This Property
The Home Valuation Report is an in-depth analysis detailing your home's value as well as a comparison with similar homes in the area
Home Values in the Area
Average Home Value in this Area
Purchase History
| Date | Buyer | Sale Price | Title Company |
|---|---|---|---|
| Ottmann Trevor J | $133,000 | Otoe County Title Co | |
| Meyer Ryan W | $145,000 | Ntc | |
| Cherry Hill Homes Inc | $25,000 | Nt |
Source: Public Records
Mortgage History
| Date | Status | Borrower | Loan Amount |
|---|---|---|---|
| Open | Ottmann Trevor J | $135,204 | |
| Previous Owner | Meyer Ryan W | $135,531 |
Source: Public Records
Tax History Compared to Growth
Tax History
| Year | Tax Paid | Tax Assessment Tax Assessment Total Assessment is a certain percentage of the fair market value that is determined by local assessors to be the total taxable value of land and additions on the property. | Land | Improvement |
|---|---|---|---|---|
| 2025 | $3,001 | $287,900 | $70,000 | $217,900 |
| 2024 | $3,001 | $233,000 | $62,000 | $171,000 |
| 2023 | $4,070 | $233,000 | $62,000 | $171,000 |
| 2022 | $3,862 | $204,300 | $48,000 | $156,300 |
| 2021 | $3,642 | $204,300 | $48,000 | $156,300 |
| 2020 | $3,425 | $185,100 | $48,000 | $137,100 |
| 2019 | $3,445 | $185,100 | $48,000 | $137,100 |
| 2018 | $2,865 | $148,000 | $35,000 | $113,000 |
| 2017 | $2,772 | $148,000 | $35,000 | $113,000 |
| 2016 | $2,954 | $144,500 | $30,000 | $114,500 |
| 2015 | $2,893 | $144,500 | $30,000 | $114,500 |
| 2014 | $2,923 | $143,200 | $30,000 | $113,200 |
| 2013 | -- | $143,200 | $30,000 | $113,200 |
Source: Public Records
Map
Nearby Homes
- 135 Jefferson St
- Acreage 1 134th & Satillo Rd
- 195 Switchgrass Ln
- 185 Switchgrass Ln
- 380 Van Buren St
- 0000 Jackson St
- 1240 Hackberry St
- 1220 Evergreen Rd
- 920 Evergreen Rd
- 985 Evergreen Rd
- 400 Evergreen Rd
- 415 Evergreen Rd
- 1223 Evergreen Rd
- 1020 Evergreen Rd
- 1000 Evergreen Rd
- 1140 Evergreen Rd
- 1125 Evergreen Rd
- 420 Evergreen Rd
- 1180 Evergreen Rd
- 915 Evergreen Rd