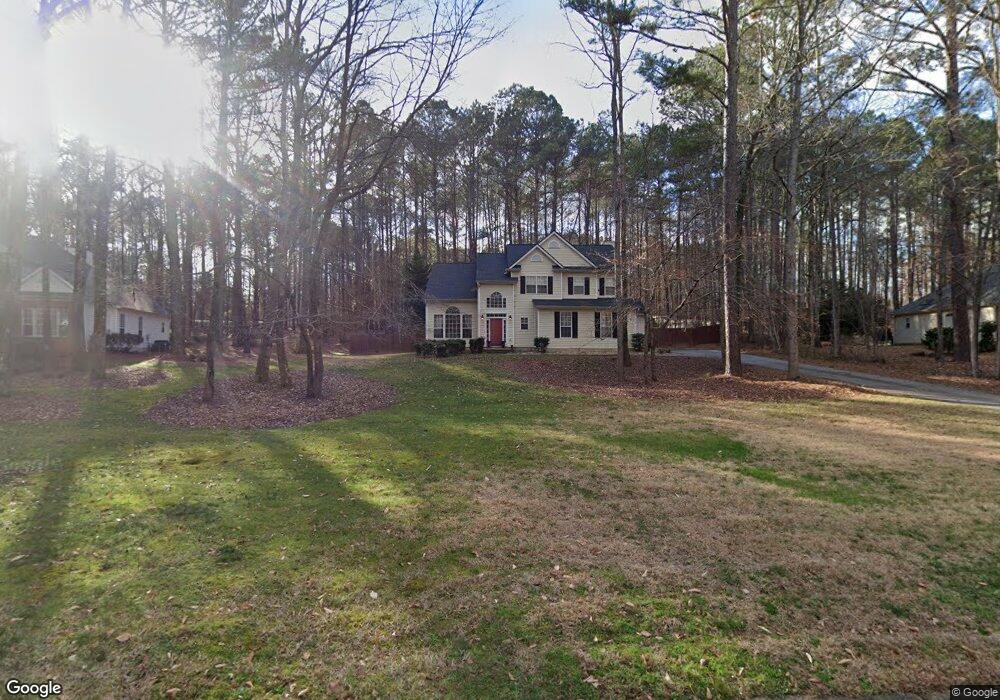
155 Mockingbird Trail Unit I Peachtree City, GA 30269
Estimated Value: $598,676 - $650,000
--
Bed
--
Bath
2,353
Sq Ft
$268/Sq Ft
Est. Value
About This Home
This home is located at 155 Mockingbird Trail Unit I, Peachtree City, GA 30269 and is currently estimated at $630,919, approximately $268 per square foot. 155 Mockingbird Trail Unit I is a home located in Fayette County with nearby schools including Peeples Elementary School, Rising Starr Middle School, and Starrs Mill High School.
Ownership History
Date
Name
Owned For
Owner Type
Purchase Details
Closed on
Aug 25, 2025
Sold by
Curry Tonya C
Bought by
Tonya Cureton Curry Living Trust and Curry
Current Estimated Value
Purchase Details
Closed on
Jun 25, 2001
Sold by
Henley Michael D and Henley Susan E
Bought by
Rouse Shawn T and Rouse Dawn L
Home Financials for this Owner
Home Financials are based on the most recent Mortgage that was taken out on this home.
Original Mortgage
$205,000
Interest Rate
6.13%
Mortgage Type
New Conventional
Purchase Details
Closed on
Mar 31, 1998
Sold by
Whitty Charles D and Whitty Mary A
Bought by
Henley Michael D and Henley Susan E
Home Financials for this Owner
Home Financials are based on the most recent Mortgage that was taken out on this home.
Original Mortgage
$165,000
Interest Rate
6.95%
Mortgage Type
New Conventional
Purchase Details
Closed on
Nov 16, 1995
Sold by
Wieland Homes
Bought by
Whitty Charles D Maryann
Create a Home Valuation Report for This Property
The Home Valuation Report is an in-depth analysis detailing your home's value as well as a comparison with similar homes in the area
Home Values in the Area
Average Home Value in this Area
Purchase History
| Date | Buyer | Sale Price | Title Company |
|---|---|---|---|
| Tonya Cureton Curry Living Trust | -- | None Listed On Document | |
| Rouse Shawn T | $228,000 | -- | |
| Henley Michael D | $185,000 | -- | |
| Whitty Charles D Maryann | $162,400 | -- |
Source: Public Records
Mortgage History
| Date | Status | Borrower | Loan Amount |
|---|---|---|---|
| Previous Owner | Rouse Shawn T | $205,000 | |
| Previous Owner | Henley Michael D | $165,000 | |
| Closed | Whitty Charles D Maryann | $0 |
Source: Public Records
Tax History Compared to Growth
Tax History
| Year | Tax Paid | Tax Assessment Tax Assessment Total Assessment is a certain percentage of the fair market value that is determined by local assessors to be the total taxable value of land and additions on the property. | Land | Improvement |
|---|---|---|---|---|
| 2024 | $4,664 | $215,320 | $40,000 | $175,320 |
| 2023 | $4,148 | $193,960 | $40,000 | $153,960 |
| 2022 | $4,451 | $190,920 | $40,000 | $150,920 |
| 2021 | $4,107 | $154,020 | $28,500 | $125,520 |
| 2020 | $4,126 | $146,340 | $28,500 | $117,840 |
| 2019 | $3,866 | $135,700 | $28,500 | $107,200 |
| 2018 | $3,999 | $138,780 | $28,500 | $110,280 |
| 2017 | $3,917 | $135,420 | $28,500 | $106,920 |
| 2016 | $3,520 | $119,180 | $28,500 | $90,680 |
| 2015 | $3,144 | $104,660 | $28,500 | $76,160 |
| 2014 | $2,924 | $95,860 | $28,500 | $67,360 |
| 2013 | -- | $91,900 | $0 | $0 |
Source: Public Records
Map
Nearby Homes
- 105 Kraftwood Park
- 155 W Creek Ct
- 613 Preserve Place
- 608 Preserve Place
- 423 Holly Grove Church Rd
- 122 Holly Springs Dr
- 418 Holly Brook Ln
- 555 Mountains Edge
- 1607 Dumbarton Ln
- 638 Grecken Green
- 401 Vardon Way
- 1306 Yarborough Dr
- 230 Stonehaven Dr
- 121 Tamerlane
- 211 Felspar Ridge
- 312 Evian Way
- 313 Evian Way
- 190 Bontura Dr
- 140 Bontura Dr
- 270 Carrolls Way
- 145 Mockingbird Trail
- 165 Mockingbird Trail Unit 1
- 135 Mockingbird Trail Unit 1
- 175 Mockingbird Trail
- 0 Mockingbird Trail Unit 8732061
- 150 Mockingbird Trail
- 125 Mockingbird Trail Unit 1
- 160 Mockingbird Trail
- 170 Mockingbird Trail
- 404 Ironwood Ln
- 708 Redwood Park
- 185 Jefferson Woods Dr Unit 2
- 115 Mockingbird Trail Unit 1
- 402 Ironwood Ln
- 110 Mockingbird Trail Unit 1
- 208 Ashton Park
- 206 Ashton Park
- 706 Redwood Park
- 710 Redwood Park
- 175 Jefferson Woods Dr Unit 2