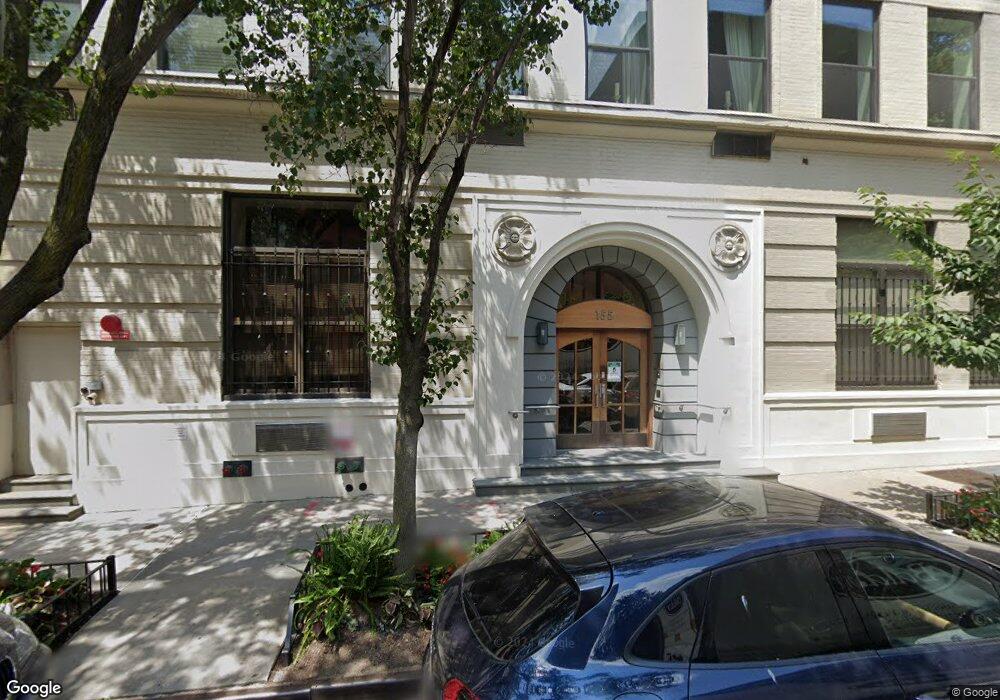
155 Perry St Unit 4B New York, NY 10014
West Village NeighborhoodEstimated Value: $2,047,108 - $2,779,000
--
Bed
--
Bath
1,210
Sq Ft
$2,102/Sq Ft
Est. Value
About This Home
This home is located at 155 Perry St Unit 4B, New York, NY 10014 and is currently estimated at $2,543,027, approximately $2,101 per square foot. 155 Perry St Unit 4B is a home located in New York County with nearby schools including P.S. 41 Greenwich Village, Middle School 297, and Clinton School.
Ownership History
Date
Name
Owned For
Owner Type
Purchase Details
Closed on
Sep 13, 2017
Sold by
Livingston Jennifer
Bought by
Livingston Jennifer
Current Estimated Value
Purchase Details
Closed on
Jan 12, 2005
Sold by
Israely Beverly and Kelly Frederick
Bought by
Adler Ian and Livingston Jennifer
Home Financials for this Owner
Home Financials are based on the most recent Mortgage that was taken out on this home.
Original Mortgage
$978,750
Interest Rate
5.67%
Mortgage Type
Purchase Money Mortgage
Purchase Details
Closed on
Mar 17, 1999
Sold by
Drake Corp
Bought by
Kelly Frederick and Israely Beverly
Home Financials for this Owner
Home Financials are based on the most recent Mortgage that was taken out on this home.
Original Mortgage
$404,000
Interest Rate
6.75%
Create a Home Valuation Report for This Property
The Home Valuation Report is an in-depth analysis detailing your home's value as well as a comparison with similar homes in the area
Home Values in the Area
Average Home Value in this Area
Purchase History
| Date | Buyer | Sale Price | Title Company |
|---|---|---|---|
| Livingston Jennifer | -- | -- | |
| Adler Ian | $1,305,000 | -- | |
| Adler Ian | $1,305,000 | -- | |
| Kelly Frederick | $505,000 | First American Title Ins Co | |
| Kelly Frederick | $505,000 | First American Title Ins Co |
Source: Public Records
Mortgage History
| Date | Status | Borrower | Loan Amount |
|---|---|---|---|
| Previous Owner | Adler Ian | $978,750 | |
| Previous Owner | Kelly Frederick | $404,000 |
Source: Public Records
Tax History Compared to Growth
Tax History
| Year | Tax Paid | Tax Assessment Tax Assessment Total Assessment is a certain percentage of the fair market value that is determined by local assessors to be the total taxable value of land and additions on the property. | Land | Improvement |
|---|---|---|---|---|
| 2025 | $22,940 | $185,365 | $27,601 | $157,764 |
| 2024 | $22,940 | $183,492 | $27,601 | $155,891 |
| 2023 | $18,002 | $177,881 | $27,601 | $150,280 |
| 2022 | $17,667 | $183,398 | $27,601 | $155,797 |
| 2021 | $20,165 | $164,386 | $27,601 | $136,785 |
| 2020 | $17,555 | $183,424 | $27,601 | $155,823 |
| 2019 | $16,771 | $174,322 | $27,601 | $146,721 |
| 2018 | $19,509 | $169,610 | $27,600 | $142,010 |
| 2017 | $18,835 | $171,664 | $27,601 | $144,063 |
| 2016 | $17,886 | $168,917 | $27,601 | $141,316 |
| 2015 | $9,201 | $136,335 | $27,601 | $108,734 |
| 2014 | $9,201 | $135,360 | $27,601 | $107,759 |
Source: Public Records
Map
Nearby Homes
- 165 Perry St Unit 5-A
- 165 Perry St Unit 1D
- 167 Perry St Unit 4NQ
- 167 Perry St Unit 5K
- 167 Perry St Unit 4ACD
- 167 Perry St Unit 2H
- 167 Perry St Unit 5F
- 708 Washington St Unit 5B
- 700 Washington St Unit 2B
- 166 Perry St Unit 6B
- 8 Charles Ln Unit C
- 8 Charles Ln Unit A
- 377 W 11th St Unit 1D
- 377 W 11th St Unit 3A
- 377 W 11th St Unit 3G
- 357 W 11th St Unit 3B
- 353 W 11th St Unit 2B
- 684 Washington St Unit GA
- 165 Charles St Unit RSU14
- 165 Charles St Unit 1
- 155 Perry St Unit 1D
- 155 Perry St Unit 8D
- 155 Perry St Unit 8C
- 155 Perry St Unit 8B
- 155 Perry St Unit 8A
- 155 Perry St Unit 7D
- 155 Perry St Unit 7C
- 155 Perry St Unit 7B
- 155 Perry St Unit 7A
- 155 Perry St Unit 6D
- 155 Perry St Unit 6C
- 155 Perry St Unit 6B
- 155 Perry St Unit 6A
- 155 Perry St Unit 5D
- 155 Perry St Unit 5C
- 155 Perry St Unit 5B
- 155 Perry St Unit 5A
- 155 Perry St Unit 4D
- 155 Perry St Unit 4C
- 155 Perry St Unit 4A