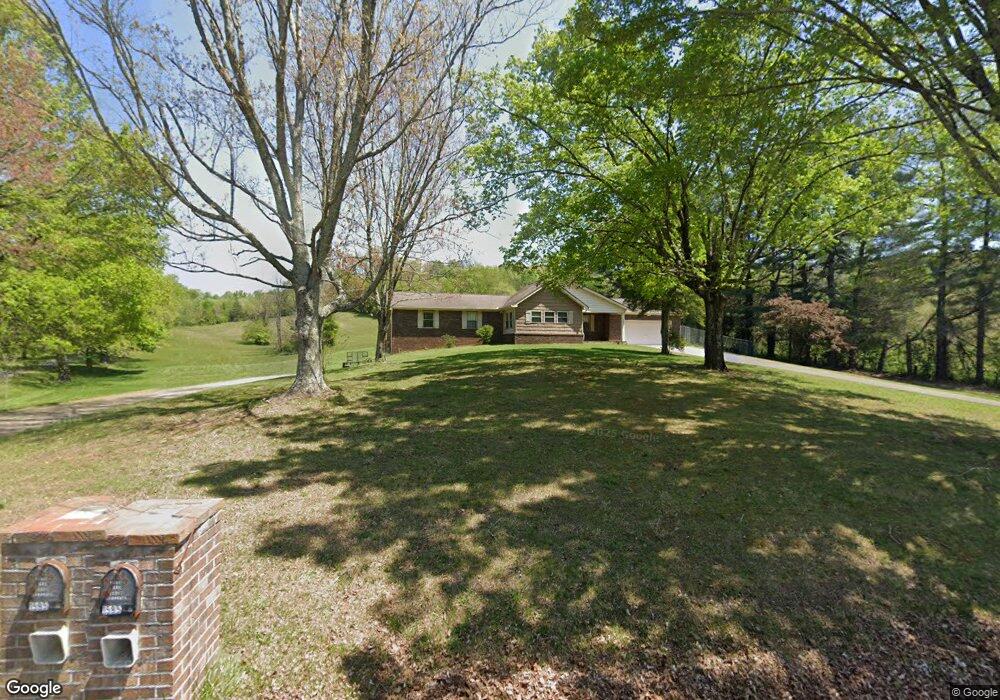
1550 Joe Stephens Rd Morristown, TN 37814
Estimated Value: $251,000 - $449,000
--
Bed
2
Baths
1,904
Sq Ft
$193/Sq Ft
Est. Value
About This Home
This home is located at 1550 Joe Stephens Rd, Morristown, TN 37814 and is currently estimated at $367,712, approximately $193 per square foot. 1550 Joe Stephens Rd is a home located in Hamblen County with nearby schools including Manley Elementary School, West View Middle School, and Morristown West High School.
Ownership History
Date
Name
Owned For
Owner Type
Purchase Details
Closed on
Aug 22, 2012
Sold by
Lemka Kenneth Scott
Bought by
Serafino Ruth A
Current Estimated Value
Home Financials for this Owner
Home Financials are based on the most recent Mortgage that was taken out on this home.
Original Mortgage
$153,600
Outstanding Balance
$105,704
Interest Rate
3.53%
Mortgage Type
Commercial
Estimated Equity
$262,008
Purchase Details
Closed on
Jul 5, 2011
Sold by
Hsbc Bank Usa National Ass
Bought by
Lemka Kenneth Scott
Purchase Details
Closed on
May 5, 2011
Sold by
Phillips Brenda Ann
Bought by
Hsbc Bank Usa National Associa
Purchase Details
Closed on
Jan 1, 2009
Sold by
Sawyer Mark C
Bought by
Sawyer Lisa N
Purchase Details
Closed on
Jun 19, 2008
Sold by
Lynn Phillips C
Bought by
Sawyer Mark
Purchase Details
Closed on
Jul 5, 1973
Bought by
Phillips Lynn C and Phillips Brenda
Create a Home Valuation Report for This Property
The Home Valuation Report is an in-depth analysis detailing your home's value as well as a comparison with similar homes in the area
Home Values in the Area
Average Home Value in this Area
Purchase History
| Date | Buyer | Sale Price | Title Company |
|---|---|---|---|
| Serafino Ruth A | $192,000 | -- | |
| Lemka Kenneth Scott | $88,556 | -- | |
| Hsbc Bank Usa National Associa | $117,885 | -- | |
| Sawyer Lisa N | -- | -- | |
| Sawyer Mark | $195,000 | -- | |
| Phillips Lynn C | -- | -- |
Source: Public Records
Mortgage History
| Date | Status | Borrower | Loan Amount |
|---|---|---|---|
| Open | Serafino Ruth A | $153,600 |
Source: Public Records
Tax History Compared to Growth
Tax History
| Year | Tax Paid | Tax Assessment Tax Assessment Total Assessment is a certain percentage of the fair market value that is determined by local assessors to be the total taxable value of land and additions on the property. | Land | Improvement |
|---|---|---|---|---|
| 2024 | $1,111 | $56,400 | $13,750 | $42,650 |
| 2023 | $1,111 | $56,400 | $0 | $0 |
| 2022 | $1,111 | $56,400 | $13,750 | $42,650 |
| 2021 | $1,063 | $53,975 | $13,750 | $40,225 |
| 2020 | $1,063 | $53,975 | $13,750 | $40,225 |
| 2019 | $1,078 | $50,600 | $13,750 | $36,850 |
| 2018 | $1,078 | $50,600 | $13,750 | $36,850 |
| 2017 | $1,078 | $50,600 | $13,750 | $36,850 |
| 2016 | $1,007 | $50,600 | $13,750 | $36,850 |
| 2015 | $936 | $50,600 | $13,750 | $36,850 |
| 2014 | -- | $50,600 | $13,750 | $36,850 |
| 2013 | -- | $55,800 | $0 | $0 |
Source: Public Records
Map
Nearby Homes
- 1335 Joe Stephens Rd
- 1855 Joe Stephens Rd
- 3245 Emerald Ave
- 3415 Emerald Ave
- 1540 Kidwell Ridge Rd
- 1995 Bluebird Cir
- 1987 Joe Stephens Rd
- 1701 Old Oak Ln
- 3864 Apostle Rd
- 2992 Clear View Rd
- 1466 Dandelion Cir
- 985 Kidwell Ridge Rd
- 1406 Dandelion Cir
- 1019 Ashley Ct
- 3641 Meadowland Dr
- 837 Foxglove Ln
- 3721 Meadowland Dr
- 4193 Scarlett Dr
- 623 Landen Cir
- 1465 Wind Crest Dr
- 1585 Joe Stephens Rd
- 1625 Joe Stephens Rd
- 1645 Joe Stephens Rd
- 1520 Ledean Dr
- 1675 Joe Stephens Rd
- 1542 Ledean Dr
- 1528 Ledean Dr
- 1572 Ledean Dr
- 1685 Joe Stephens Rd
- 1432 Joe Stephens Rd
- 1592 Ledean Dr
- 1620 Joe Stephens Rd
- 1460 Joe Stephens Rd
- 1460 Joe Stephens Rd
- 1614 Ledean Dr
- 1614 Ledean Dr
- 1596 Joe Stephens Rd
- 1445 Joe Stephens Rd
- 1634 Ledean Dr
- 1695 Joe Stephens Rd