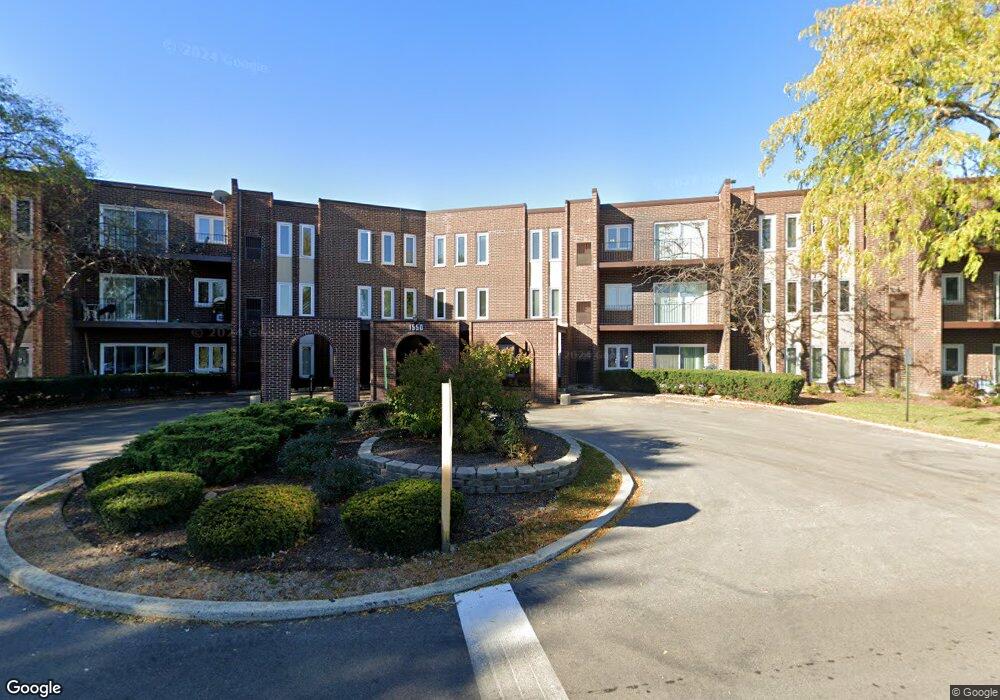
1550 Sandpebble Dr Unit 206 Wheeling, IL 60090
Estimated Value: $204,633 - $235,000
2
Beds
2
Baths
1,012
Sq Ft
$223/Sq Ft
Est. Value
About This Home
This home is located at 1550 Sandpebble Dr Unit 206, Wheeling, IL 60090 and is currently estimated at $225,408, approximately $222 per square foot. 1550 Sandpebble Dr Unit 206 is a home located in Cook County with nearby schools including Dwight D Eisenhower Elementary School, Anne Sullivan Elementary School, and Betsy Ross Elementary School.
Ownership History
Date
Name
Owned For
Owner Type
Purchase Details
Closed on
Jul 31, 2017
Sold by
Faktorovich Mark and Faktorovich Regina
Bought by
Laugovyi Peter and Lugova Oksana
Current Estimated Value
Home Financials for this Owner
Home Financials are based on the most recent Mortgage that was taken out on this home.
Original Mortgage
$86,400
Outstanding Balance
$72,877
Interest Rate
4.37%
Mortgage Type
New Conventional
Estimated Equity
$152,531
Purchase Details
Closed on
Feb 18, 2003
Sold by
Faktorovich Mark and Faktorovich Regina
Bought by
Faktorovich Mark and Faktorovich Regina
Purchase Details
Closed on
Sep 26, 1997
Sold by
Carneal Clark and Carneal Celeste
Bought by
Faktorovich Mark and Faktorovich Regina
Home Financials for this Owner
Home Financials are based on the most recent Mortgage that was taken out on this home.
Original Mortgage
$66,000
Interest Rate
7.51%
Create a Home Valuation Report for This Property
The Home Valuation Report is an in-depth analysis detailing your home's value as well as a comparison with similar homes in the area
Home Values in the Area
Average Home Value in this Area
Purchase History
| Date | Buyer | Sale Price | Title Company |
|---|---|---|---|
| Laugovyi Peter | $112,500 | Stewart Title | |
| Faktorovich Mark | -- | -- | |
| Faktorovich Mark | $58,666 | -- |
Source: Public Records
Mortgage History
| Date | Status | Borrower | Loan Amount |
|---|---|---|---|
| Open | Laugovyi Peter | $86,400 | |
| Previous Owner | Faktorovich Mark | $66,000 |
Source: Public Records
Tax History Compared to Growth
Tax History
| Year | Tax Paid | Tax Assessment Tax Assessment Total Assessment is a certain percentage of the fair market value that is determined by local assessors to be the total taxable value of land and additions on the property. | Land | Improvement |
|---|---|---|---|---|
| 2024 | $2,407 | $11,420 | $418 | $11,002 |
| 2023 | $2,274 | $11,420 | $418 | $11,002 |
| 2022 | $2,274 | $11,420 | $418 | $11,002 |
| 2021 | $2,137 | $9,787 | $285 | $9,502 |
| 2020 | $2,153 | $9,787 | $285 | $9,502 |
| 2019 | $2,165 | $10,923 | $285 | $10,638 |
| 2018 | $932 | $6,380 | $247 | $6,133 |
| 2017 | $1,991 | $6,380 | $247 | $6,133 |
| 2016 | $1,851 | $6,380 | $247 | $6,133 |
| 2015 | $1,342 | $4,245 | $218 | $4,027 |
| 2014 | $1,311 | $4,245 | $218 | $4,027 |
| 2013 | $1,269 | $4,245 | $218 | $4,027 |
Source: Public Records
Map
Nearby Homes
- 1550 Sandpebble Dr Unit 307
- 1550 Sandpebble Dr Unit 209
- 1575 Sandpebble Dr Unit 226
- 1575 Sandpebble Dr Unit 336
- 1450 Sandpebble Dr Unit 333
- 1450 Sandpebble Dr Unit 227
- 1500 Sandstone Dr Unit 307
- 1425 Sandpebble Dr Unit 340
- 1430 Sandstone Dr Unit 202
- 9 Kenneth Ave
- 688 Equestrian Dr
- 890 N Elmhurst Rd
- 1201 Pleasant Run Dr Unit 312
- 161 Lucerne Ct Unit 111713
- 150 Lucerne Ct Unit 51713
- 802 Andover Ct
- 1655 Geneva Dr Unit 43714
- 11 W Palatine Rd
- 1719 Sienna Ct Unit 242714
- 1054 Shady Tree Ln
- 1550 Sandpebble Dr Unit 108
- 1550 Sandpebble Dr Unit 104
- 1550 Sandpebble Dr Unit 110
- 1550 Sandpebble Dr Unit 302
- 1550 Sandpebble Dr Unit 312
- 1550 Sandpebble Dr Unit 102
- 1550 Sandpebble Dr Unit 305
- 1550 Sandpebble Dr Unit 107
- 1550 Sandpebble Dr Unit 111
- 1550 Sandpebble Dr Unit 103
- 1550 Sandpebble Dr Unit 306
- 1550 Sandpebble Dr Unit 105
- 1550 Sandpebble Dr Unit 208
- 1550 Sandpebble Dr Unit 109
- 1550 Sandpebble Dr Unit 112
- 1550 Sandpebble Dr Unit 216
- 1550 Sandpebble Dr Unit 309
- 1550 Sandpebble Dr Unit 310
- 1550 Sandpebble Dr Unit 210
- 1550 Sandpebble Dr Unit 313