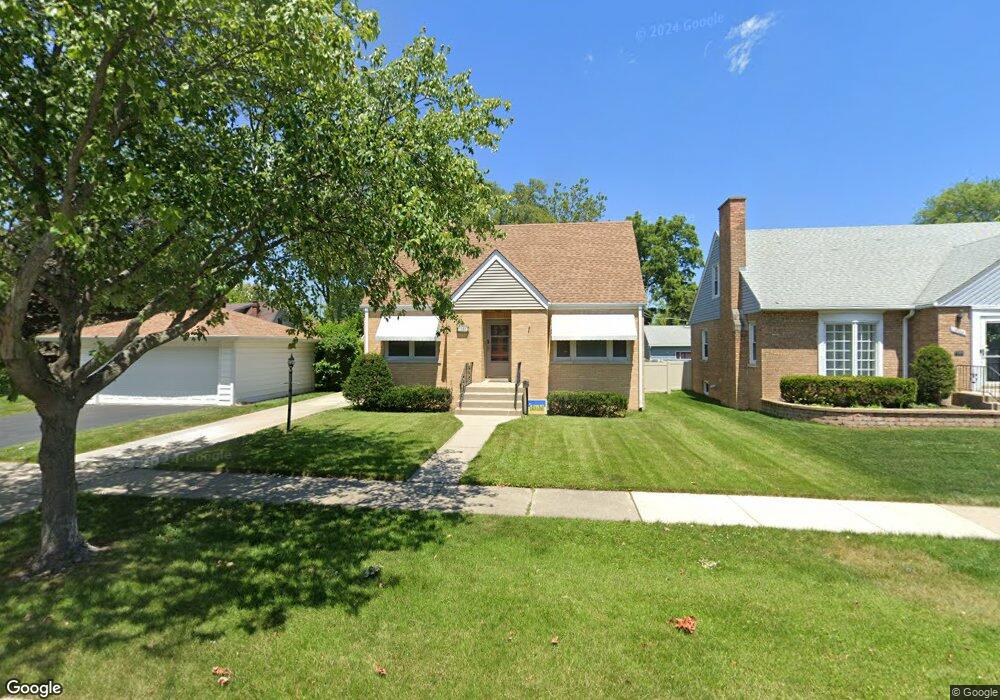
1550 Wicke Ave Des Plaines, IL 60018
Estimated Value: $288,000 - $366,000
2
Beds
1
Bath
790
Sq Ft
$403/Sq Ft
Est. Value
About This Home
This home is located at 1550 Wicke Ave, Des Plaines, IL 60018 and is currently estimated at $318,123, approximately $402 per square foot. 1550 Wicke Ave is a home located in Cook County with nearby schools including Central Elementary School, Chippewa Middle School, and Maine West High School.
Ownership History
Date
Name
Owned For
Owner Type
Purchase Details
Closed on
Nov 21, 2011
Sold by
Zitkus Julie J
Bought by
Petelle Julie J
Current Estimated Value
Home Financials for this Owner
Home Financials are based on the most recent Mortgage that was taken out on this home.
Original Mortgage
$65,000
Outstanding Balance
$6,114
Interest Rate
4.02%
Mortgage Type
New Conventional
Estimated Equity
$312,009
Purchase Details
Closed on
Feb 22, 2002
Sold by
Zitkus John
Bought by
Zitkus Julie J
Home Financials for this Owner
Home Financials are based on the most recent Mortgage that was taken out on this home.
Original Mortgage
$133,000
Interest Rate
7.11%
Purchase Details
Closed on
Apr 12, 1996
Sold by
Stocki Carol A and Stocki Carol
Bought by
Zitkus John P and Zitkus Julie J
Home Financials for this Owner
Home Financials are based on the most recent Mortgage that was taken out on this home.
Original Mortgage
$125,600
Interest Rate
7.46%
Create a Home Valuation Report for This Property
The Home Valuation Report is an in-depth analysis detailing your home's value as well as a comparison with similar homes in the area
Home Values in the Area
Average Home Value in this Area
Purchase History
| Date | Buyer | Sale Price | Title Company |
|---|---|---|---|
| Petelle Julie J | -- | Cti | |
| Zitkus Julie J | -- | Chicago Title Insurance Co | |
| Zitkus John P | $157,000 | -- |
Source: Public Records
Mortgage History
| Date | Status | Borrower | Loan Amount |
|---|---|---|---|
| Open | Petelle Julie J | $65,000 | |
| Previous Owner | Zitkus Julie J | $133,000 | |
| Previous Owner | Zitkus John P | $125,600 |
Source: Public Records
Tax History Compared to Growth
Tax History
| Year | Tax Paid | Tax Assessment Tax Assessment Total Assessment is a certain percentage of the fair market value that is determined by local assessors to be the total taxable value of land and additions on the property. | Land | Improvement |
|---|---|---|---|---|
| 2024 | $5,359 | $23,640 | $5,320 | $18,320 |
| 2023 | $5,553 | $25,000 | $5,320 | $19,680 |
| 2022 | $5,553 | $25,000 | $5,320 | $19,680 |
| 2021 | $4,613 | $18,336 | $4,322 | $14,014 |
| 2020 | $4,604 | $18,336 | $4,322 | $14,014 |
| 2019 | $4,560 | $20,374 | $4,322 | $16,052 |
| 2018 | $4,484 | $18,428 | $3,823 | $14,605 |
| 2017 | $4,422 | $18,428 | $3,823 | $14,605 |
| 2016 | $4,427 | $18,428 | $3,823 | $14,605 |
| 2015 | $4,392 | $17,150 | $3,325 | $13,825 |
| 2014 | $4,315 | $17,150 | $3,325 | $13,825 |
| 2013 | $4,190 | $17,150 | $3,325 | $13,825 |
Source: Public Records
Map
Nearby Homes
- 1536 Orchard St
- 1700 E Forest Ave
- 1632 S Elm St
- 1489 E Algonquin Rd
- 1689 S Elm St
- 1721 Linden St
- 1724 Illinois St
- 1278 E River Dr
- 1640 S River Rd
- 1928 Kennicott Ct
- 1524 Oakwood Ave
- 1783 Lee St
- 960 S River Rd Unit 410
- 960 S River Rd Unit 208
- 1050 E Oakton St
- 1365 Ashland Ave Unit 302
- 905 Center St Unit B507
- 905 Center St Unit B208
- 991 Wicke Ave
- 2017 Pine St Unit B
- 1566 Wicke Ave
- 1566 Wicke Ave
- 1520 Wicke Ave
- 1441 S Cora St
- 1431 S Cora St
- 1446 White St
- 1557 Wicke Ave
- 1541 Wicke Ave
- 1432 White St
- 1419 S Cora St
- 1581 Wicke Ave
- 1422 White St
- 1507 Wicke Ave
- 1476 White St
- 1545 E Forest Ave
- 1475 S Cora St
- 1521 E Forest Ave
- 1412 White St
- 1555 E Forest Ave
- 1488 White St