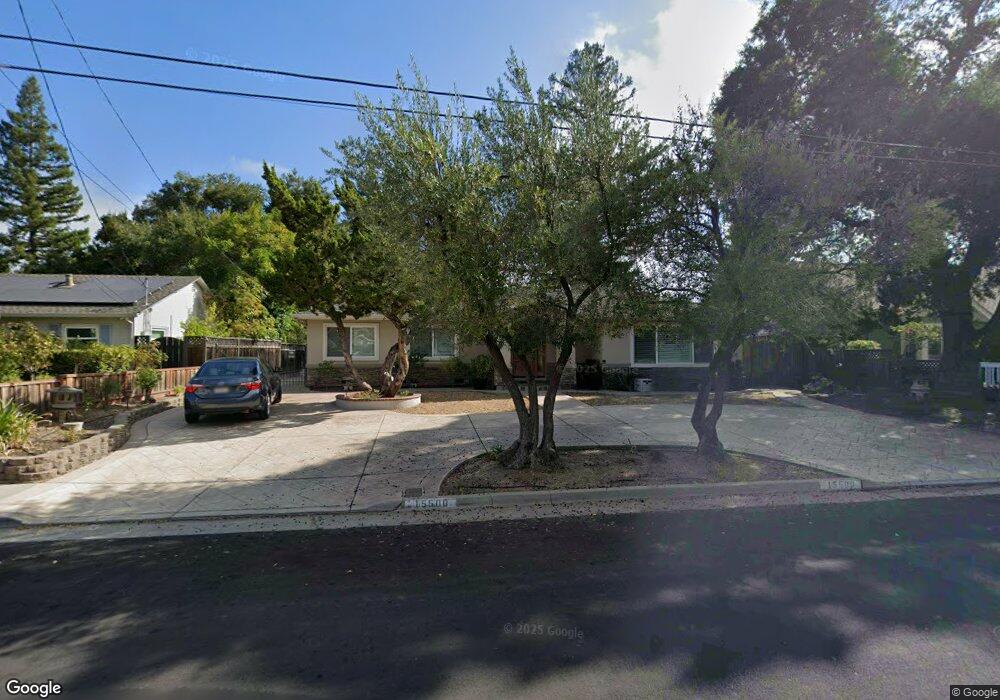
15500 Corinne Dr Los Gatos, CA 95032
East Los Gatos NeighborhoodEstimated Value: $2,699,000 - $3,161,000
4
Beds
3
Baths
2,138
Sq Ft
$1,377/Sq Ft
Est. Value
About This Home
This home is located at 15500 Corinne Dr, Los Gatos, CA 95032 and is currently estimated at $2,944,409, approximately $1,377 per square foot. 15500 Corinne Dr is a home located in Santa Clara County with nearby schools including Louise Van Meter Elementary School, Loma Prieta Elementary School, and Raymond J. Fisher Middle School.
Ownership History
Date
Name
Owned For
Owner Type
Purchase Details
Closed on
May 4, 2016
Sold by
Chan Joseph Siufai and Chan Lisa Li
Bought by
The Joseph & Lisa Chan Family Trust and Chan Lisa Li
Current Estimated Value
Purchase Details
Closed on
May 31, 2005
Sold by
Otsen Adam
Bought by
Chan Joseph Siufai and Chan Lisa Li
Home Financials for this Owner
Home Financials are based on the most recent Mortgage that was taken out on this home.
Original Mortgage
$669,000
Outstanding Balance
$348,808
Interest Rate
5.74%
Mortgage Type
Fannie Mae Freddie Mac
Estimated Equity
$2,595,601
Purchase Details
Closed on
Oct 24, 2004
Sold by
Otsen George E
Bought by
Otsen George E
Purchase Details
Closed on
Mar 25, 2002
Sold by
Otsen George E
Bought by
Otsen George E
Home Financials for this Owner
Home Financials are based on the most recent Mortgage that was taken out on this home.
Original Mortgage
$562,500
Interest Rate
6.84%
Mortgage Type
Stand Alone First
Create a Home Valuation Report for This Property
The Home Valuation Report is an in-depth analysis detailing your home's value as well as a comparison with similar homes in the area
Home Values in the Area
Average Home Value in this Area
Purchase History
| Date | Buyer | Sale Price | Title Company |
|---|---|---|---|
| The Joseph & Lisa Chan Family Trust | -- | None Available | |
| Chan Joseph Siufai | $899,000 | Stewart Title Of California | |
| Otsen George E | -- | -- | |
| Otsen George E | -- | Fidelity National Title Co |
Source: Public Records
Mortgage History
| Date | Status | Borrower | Loan Amount |
|---|---|---|---|
| Open | Chan Joseph Siufai | $669,000 | |
| Previous Owner | Otsen George E | $562,500 |
Source: Public Records
Tax History Compared to Growth
Tax History
| Year | Tax Paid | Tax Assessment Tax Assessment Total Assessment is a certain percentage of the fair market value that is determined by local assessors to be the total taxable value of land and additions on the property. | Land | Improvement |
|---|---|---|---|---|
| 2025 | $16,036 | $1,342,599 | $563,828 | $778,771 |
| 2024 | $16,036 | $1,316,274 | $552,773 | $763,501 |
| 2023 | $15,728 | $1,290,466 | $541,935 | $748,531 |
| 2022 | $15,630 | $1,265,163 | $531,309 | $733,854 |
| 2021 | $15,349 | $1,240,357 | $520,892 | $719,465 |
| 2020 | $15,071 | $1,227,639 | $515,551 | $712,088 |
| 2019 | $14,860 | $1,203,569 | $505,443 | $698,126 |
| 2018 | $14,648 | $1,179,971 | $495,533 | $684,438 |
| 2017 | $14,604 | $1,156,835 | $485,817 | $671,018 |
| 2016 | $14,219 | $1,134,153 | $476,292 | $657,861 |
| 2015 | $14,120 | $1,117,118 | $469,138 | $647,980 |
| 2014 | $13,299 | $1,045,237 | $459,949 | $585,288 |
Source: Public Records
Map
Nearby Homes
- 120 Carlton Ave Unit 22
- 209 Nob Hill Way
- 15021 Briggs Ct
- 16281 Camino Del Sol
- 16760 Magneson Loop
- 16100 Jasmine Way
- 14685 Oka Rd Unit 28
- 706 Winchester Blvd
- 15360 Karl Ave
- 15560 Camino Del Cerro
- 696 N Santa Cruz Ave
- 115 Lansberry Ct
- 16460 B Bonnie Ln
- 20 Mariposa Ave
- 216 San Mateo Ave
- 16157 E Mozart Ave
- 207 Palmer Dr
- 220 Milbrae Ln Unit 6
- 449 Alberto Way Unit C139
- 451 Alberto Way Unit 151
- 15520 Corinne Dr
- 15486 Corinne Dr
- 15501 Benedict Ln
- 15487 Benedict Ln
- 15472 Corinne Dr
- 15530 Corinne Dr
- 15515 Benedict Ln
- 15473 Benedict Ln
- 15515 Corinne Dr
- 15485 Corinne Dr
- 15501 Corinne Dr
- 15544 Corinne Dr
- 15460 Corinne Dr
- 15531 Corinne Dr
- 15471 Corinne Dr
- 15545 Benedict Ln
- 15461 Benedict Ln
- 15545 Corinne Dr
- 15560 Corinne Dr
- 16781 Chirco Ct