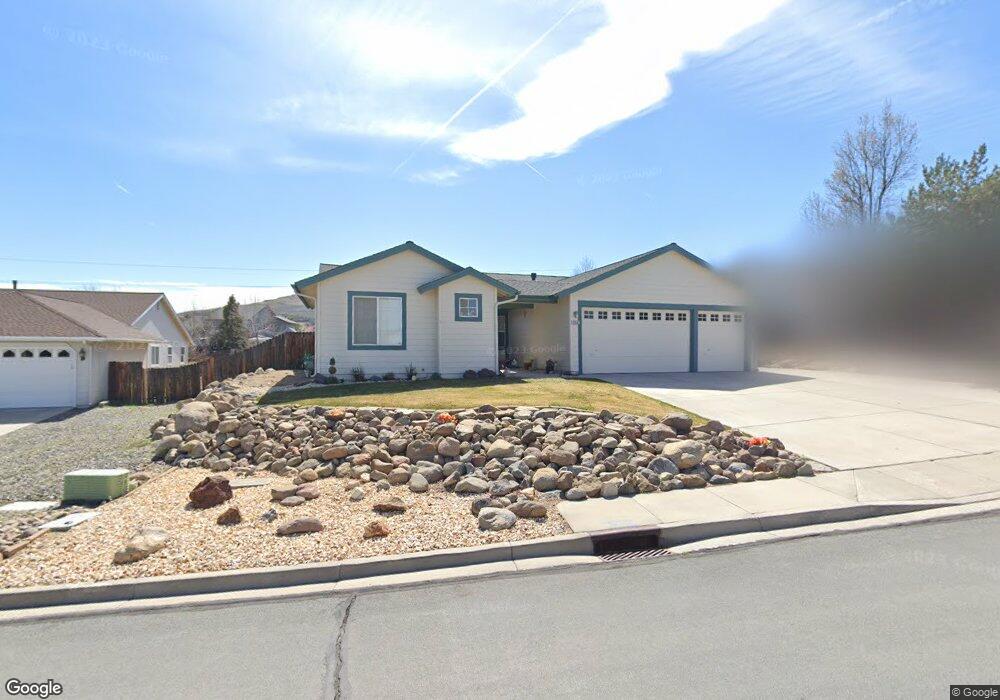
15502 Quicksilver Dr Unit 96 Reno, NV 89511
Summit Sierra NeighborhoodEstimated Value: $767,000 - $944,000
3
Beds
3
Baths
2,378
Sq Ft
$369/Sq Ft
Est. Value
About This Home
This home is located at 15502 Quicksilver Dr Unit 96, Reno, NV 89511 and is currently estimated at $876,817, approximately $368 per square foot. 15502 Quicksilver Dr Unit 96 is a home located in Washoe County with nearby schools including Elizabeth Lenz Elementary School, Marce Herz Middle School, and Galena High School.
Ownership History
Date
Name
Owned For
Owner Type
Purchase Details
Closed on
Dec 14, 2023
Sold by
Jensens Trust
Bought by
Jensen Family Trust and Jensen
Current Estimated Value
Purchase Details
Closed on
Aug 1, 2005
Sold by
Jensen Carl R
Bought by
Jensens Trust
Purchase Details
Closed on
Jun 28, 2004
Sold by
Jensen Pamela S
Bought by
Jensen Carl
Purchase Details
Closed on
Aug 21, 2003
Sold by
Jensen Stella M
Bought by
Jensen Carl R
Purchase Details
Closed on
Oct 22, 2001
Sold by
Robards Ronald Roy and Robards Donna Jeanne
Bought by
Jensen Carl R and Jensen Pamela S
Purchase Details
Closed on
Sep 21, 1999
Sold by
Jensen Carl R
Bought by
Jensen Carl R and Jensen Stella M
Purchase Details
Closed on
May 21, 1999
Sold by
Mountain View Development Inc
Bought by
Jensen Carl R
Create a Home Valuation Report for This Property
The Home Valuation Report is an in-depth analysis detailing your home's value as well as a comparison with similar homes in the area
Home Values in the Area
Average Home Value in this Area
Purchase History
| Date | Buyer | Sale Price | Title Company |
|---|---|---|---|
| Jensen Family Trust | -- | None Listed On Document | |
| Jensens Trust | -- | -- | |
| Jensen Carl | -- | -- | |
| Jensen Carl R | -- | -- | |
| Jensen Carl R | $27,000 | Founders Title Co | |
| Jensen Carl R | -- | -- | |
| Jensen Carl R | $205,000 | First Centennial Title Co |
Source: Public Records
Tax History
| Year | Tax Paid | Tax Assessment Tax Assessment Total Assessment is a certain percentage of the fair market value that is determined by local assessors to be the total taxable value of land and additions on the property. | Land | Improvement |
|---|---|---|---|---|
| 2026 | $3,050 | $164,127 | $60,445 | $103,682 |
| 2025 | $3,953 | $170,804 | $65,240 | $105,564 |
| 2024 | $3,953 | $161,337 | $54,600 | $106,737 |
| 2023 | $3,838 | $159,565 | $58,415 | $101,150 |
| 2022 | $3,726 | $130,544 | $46,445 | $84,099 |
| 2021 | $3,618 | $117,442 | $33,390 | $84,052 |
| 2020 | $3,512 | $116,192 | $31,850 | $84,342 |
| 2019 | $3,410 | $113,580 | $31,185 | $82,395 |
| 2018 | $3,311 | $104,345 | $23,590 | $80,755 |
| 2017 | $3,211 | $101,357 | $20,370 | $80,987 |
| 2016 | $3,130 | $104,782 | $21,910 | $82,872 |
| 2015 | $2,343 | $101,360 | $18,480 | $82,880 |
| 2014 | $3,033 | $97,312 | $15,715 | $81,597 |
| 2013 | -- | $90,854 | $11,025 | $79,829 |
Source: Public Records
Map
Nearby Homes
- 15509 Quicksilver Dr
- 735 Summer Star Place
- 16070 River Oaks Ct
- 17000 Wedge Pkwy Unit 1722
- 17000 Wedge Pkwy Unit 1911
- 17000 Wedge Pkwy Unit 425
- 17000 Wedge Pkwy Unit 2625
- 409 Solitude Ct
- 971 Little Star Dr
- 911 Solarium Dr
- 940 Little Star Dr
- 13480 Damonte View Ln
- 2220 Whites Creek Ln
- 1770 Kodiak Cir
- 1235 Springer Ct
- 1200 Springer Ct
- 12900 Silver Wolf Rd
- 12910 Silver Wolf Rd
- 3640 Aspen Hollow
- 40 Day Lily Ct
- 15500 Quicksilver Dr
- 15506 Quicksilver Dr
- 765 Summer Star Place
- 601 Sugar Tree Ct
- 755 Summer Star Place
- 15508 Quicksilver Dr
- 600 Sugar Tree Ct
- 603 Sugar Tree Ct
- 15503 Quicksilver Dr
- 745 Summer Star Place
- 15510 Quicksilver Dr
- 14225 Ghost Rider Dr
- 760 Summer Star Place
- 15501 Quicksilver Dr
- 15511 Quicksilver Dr
- 14235 Ghost Rider Dr
- 602 Sugar Tree Ct
- 605 Sugar Tree Ct
- 14215 Ghost Rider Dr
Your Personal Tour Guide
Ask me questions while you tour the home.