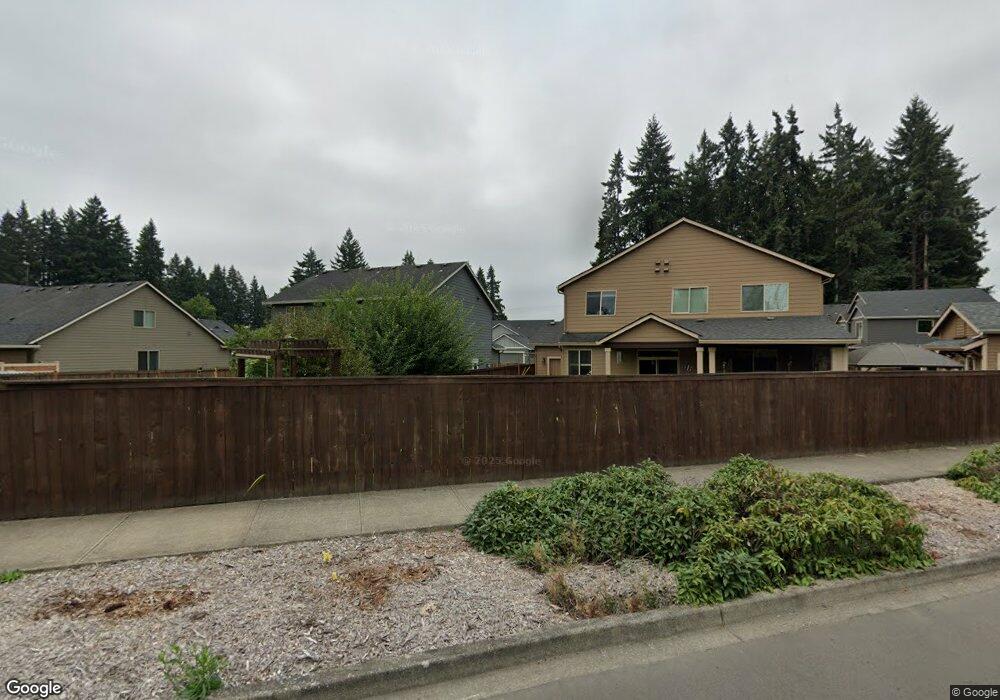
15509 NE 79th Way Unit Lot 3 Vancouver, WA 98682
Orchards Area NeighborhoodEstimated Value: $559,000 - $582,123
3
Beds
3
Baths
2,081
Sq Ft
$273/Sq Ft
Est. Value
About This Home
This home is located at 15509 NE 79th Way Unit Lot 3, Vancouver, WA 98682 and is currently estimated at $567,781, approximately $272 per square foot. 15509 NE 79th Way Unit Lot 3 is a home located in Clark County with nearby schools including Pioneer Elementary School, Frontier Middle School, and Heritage High School.
Ownership History
Date
Name
Owned For
Owner Type
Purchase Details
Closed on
May 19, 2025
Sold by
Stiffler Joseph P and Stiffler Tabitha
Bought by
Al-Zughir Hani M
Current Estimated Value
Home Financials for this Owner
Home Financials are based on the most recent Mortgage that was taken out on this home.
Original Mortgage
$440,000
Outstanding Balance
$438,495
Interest Rate
6.83%
Mortgage Type
New Conventional
Estimated Equity
$129,286
Purchase Details
Closed on
Dec 14, 2021
Sold by
Frerichs Vradley A and Coville Sue
Bought by
Stiffler Joseph P and Stiffler Tabitha
Home Financials for this Owner
Home Financials are based on the most recent Mortgage that was taken out on this home.
Original Mortgage
$484,500
Interest Rate
2.98%
Mortgage Type
New Conventional
Purchase Details
Closed on
Dec 16, 2016
Sold by
Avery Lane Llc
Bought by
Frerichs Bradley A and Coville Sue
Create a Home Valuation Report for This Property
The Home Valuation Report is an in-depth analysis detailing your home's value as well as a comparison with similar homes in the area
Home Values in the Area
Average Home Value in this Area
Purchase History
| Date | Buyer | Sale Price | Title Company |
|---|---|---|---|
| Al-Zughir Hani M | $560,000 | Chicago Title | |
| Stiffler Joseph P | $510,000 | Chicago Title | |
| Frerichs Bradley A | $314,450 | Fidelity Title Dt Vancouver |
Source: Public Records
Mortgage History
| Date | Status | Borrower | Loan Amount |
|---|---|---|---|
| Open | Al-Zughir Hani M | $440,000 | |
| Previous Owner | Stiffler Joseph P | $484,500 |
Source: Public Records
Tax History Compared to Growth
Tax History
| Year | Tax Paid | Tax Assessment Tax Assessment Total Assessment is a certain percentage of the fair market value that is determined by local assessors to be the total taxable value of land and additions on the property. | Land | Improvement |
|---|---|---|---|---|
| 2025 | $5,709 | $554,554 | $178,200 | $376,354 |
| 2024 | $5,510 | $557,353 | $178,200 | $379,153 |
| 2023 | $5,372 | $563,530 | $178,200 | $385,330 |
| 2022 | $4,935 | $540,685 | $178,200 | $362,485 |
| 2021 | $4,632 | $462,031 | $151,200 | $310,831 |
| 2020 | $4,250 | $407,487 | $135,000 | $272,487 |
| 2019 | $3,737 | $374,551 | $119,394 | $255,157 |
| 2018 | $4,234 | $354,467 | $0 | $0 |
| 2017 | $0 | $325,560 | $0 | $0 |
| 2016 | -- | $0 | $0 | $0 |
Source: Public Records
Map
Nearby Homes
- 7708 NE 159th Ave
- 7702 NE 159th Ave
- 7817 NE 152nd Ave
- 17309 NE 84th St
- 7813 NE 152nd Ave
- 15415 NE 85th St
- 8008 NE 151st Ct
- 7806 NE 151st Ave
- 8116 NE 163rd Ave
- 15212 NE 74th St
- 14902 NE 78th St
- 7515 NE 152nd Ct
- 15520 NE 87th St
- 15226 NE 72nd Way
- 15810 NE 72nd St
- 15813 NE 87th Cir
- 14911 NE 86th St
- 7137 NE 152nd Place
- 7035 NE 155th Place
- 14719 NE 85th Cir Unit 3
- 7826 NE 156th Place
- 15517 NE 79th Way Unit Lot 1
- 15517 NE 79th Way
- 7822 NE 156th Place
- 15513 NE 79th Way Unit Lot 2
- 15510 NE 79th Way
- 15510 NE 79th Way Unit Lot11
- 7902 NE 156th Place
- 15516 NE 79th Way
- 15516 NE 79th Way Unit Lot10
- 7818 NE 156th Place
- 15512 NE 79th Way
- 15512 NE 79th Way Unit Lot 9
- 7906 NE 156th Place
- 7827 NE 156th Place
- 7823 NE 156th Place
- 7901 NE 156th Place
- 7816 NE 156th Place
- 15505 NE 79th Way
- 15505 NE 79th Way Unit Lot 4