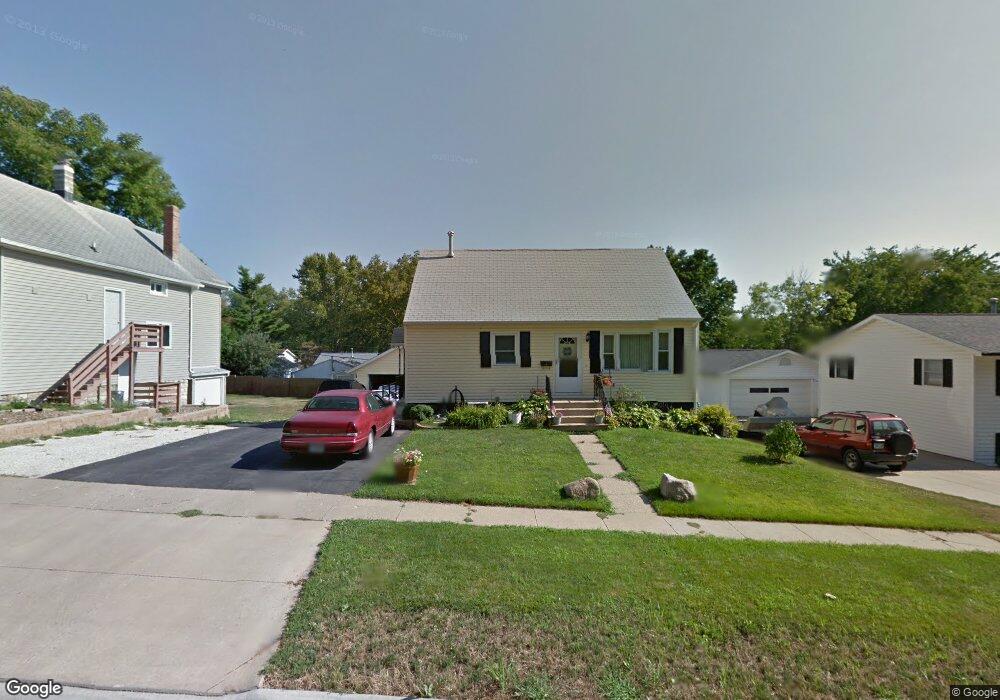
1551 3rd Ave Marion, IA 52302
Estimated Value: $186,000 - $209,000
3
Beds
2
Baths
1,280
Sq Ft
$156/Sq Ft
Est. Value
About This Home
This home is located at 1551 3rd Ave, Marion, IA 52302 and is currently estimated at $199,784, approximately $156 per square foot. 1551 3rd Ave is a home located in Linn County with nearby schools including Francis Marion Intermediate School, Vernon Middle School, and Marion High School.
Ownership History
Date
Name
Owned For
Owner Type
Purchase Details
Closed on
Sep 10, 2007
Sold by
Bartlett Michelle R
Bought by
Bartlett David L
Current Estimated Value
Purchase Details
Closed on
Aug 28, 2007
Sold by
Bartlett Michelle R
Bought by
Bartlett David L
Purchase Details
Closed on
Oct 30, 1999
Sold by
Archer Craig P and Archer Diane M
Bought by
Bartlett David L and Bartlett Michelle R
Home Financials for this Owner
Home Financials are based on the most recent Mortgage that was taken out on this home.
Original Mortgage
$81,557
Interest Rate
7.78%
Mortgage Type
FHA
Create a Home Valuation Report for This Property
The Home Valuation Report is an in-depth analysis detailing your home's value as well as a comparison with similar homes in the area
Home Values in the Area
Average Home Value in this Area
Purchase History
| Date | Buyer | Sale Price | Title Company |
|---|---|---|---|
| Bartlett David L | -- | None Available | |
| Bartlett David L | -- | None Available | |
| Bartlett David L | $81,500 | -- |
Source: Public Records
Mortgage History
| Date | Status | Borrower | Loan Amount |
|---|---|---|---|
| Previous Owner | Bartlett David L | $81,557 |
Source: Public Records
Tax History
| Year | Tax Paid | Tax Assessment Tax Assessment Total Assessment is a certain percentage of the fair market value that is determined by local assessors to be the total taxable value of land and additions on the property. | Land | Improvement |
|---|---|---|---|---|
| 2025 | $3,554 | $223,000 | $17,900 | $205,100 |
| 2024 | $3,018 | $199,800 | $17,900 | $181,900 |
| 2023 | $3,018 | $199,800 | $17,900 | $181,900 |
| 2022 | $2,914 | $144,500 | $17,900 | $126,600 |
| 2021 | $2,850 | $144,500 | $17,900 | $126,600 |
| 2020 | $2,850 | $134,700 | $17,900 | $116,800 |
| 2019 | $2,658 | $126,500 | $17,900 | $108,600 |
Source: Public Records
Map
Nearby Homes
Your Personal Tour Guide
Ask me questions while you tour the home.