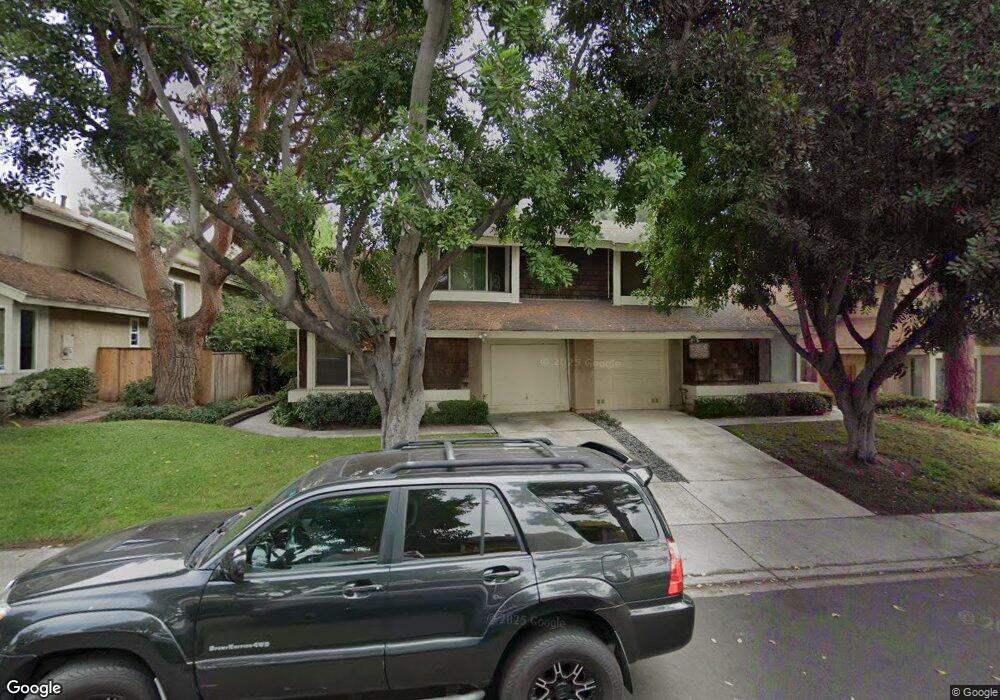
1551 Bridgeview Dr San Diego, CA 92105
Fairmount Park NeighborhoodEstimated Value: $713,033 - $789,000
3
Beds
2
Baths
1,357
Sq Ft
$565/Sq Ft
Est. Value
About This Home
This home is located at 1551 Bridgeview Dr, San Diego, CA 92105 and is currently estimated at $767,008, approximately $565 per square foot. 1551 Bridgeview Dr is a home located in San Diego County with nearby schools including Rowan Elementary School, Clark Middle School, and Herbert Hoover High School.
Ownership History
Date
Name
Owned For
Owner Type
Purchase Details
Closed on
Jul 26, 2010
Sold by
Campbell Adele and Campbell Adele M
Bought by
Campbell Adele
Current Estimated Value
Home Financials for this Owner
Home Financials are based on the most recent Mortgage that was taken out on this home.
Original Mortgage
$182,500
Outstanding Balance
$121,683
Interest Rate
4.71%
Mortgage Type
New Conventional
Estimated Equity
$645,325
Purchase Details
Closed on
Mar 3, 2000
Sold by
Serrano Raul Carlos
Bought by
Campbell Adele M
Home Financials for this Owner
Home Financials are based on the most recent Mortgage that was taken out on this home.
Original Mortgage
$116,000
Interest Rate
8.26%
Mortgage Type
Stand Alone First
Purchase Details
Closed on
Jul 28, 1995
Sold by
Campbell Jeffrey N
Bought by
Campbell Adele M
Home Financials for this Owner
Home Financials are based on the most recent Mortgage that was taken out on this home.
Original Mortgage
$111,100
Interest Rate
6.87%
Purchase Details
Closed on
Oct 6, 1987
Create a Home Valuation Report for This Property
The Home Valuation Report is an in-depth analysis detailing your home's value as well as a comparison with similar homes in the area
Home Values in the Area
Average Home Value in this Area
Purchase History
| Date | Buyer | Sale Price | Title Company |
|---|---|---|---|
| Campbell Adele | -- | Fidelity National Title Co | |
| Campbell Adele M | -- | South Coast Title Company | |
| Campbell Adele M | -- | Southland Title Corporation | |
| -- | $101,500 | -- |
Source: Public Records
Mortgage History
| Date | Status | Borrower | Loan Amount |
|---|---|---|---|
| Open | Campbell Adele | $182,500 | |
| Closed | Campbell Adele M | $116,000 | |
| Closed | Campbell Adele M | $111,100 |
Source: Public Records
Tax History
| Year | Tax Paid | Tax Assessment Tax Assessment Total Assessment is a certain percentage of the fair market value that is determined by local assessors to be the total taxable value of land and additions on the property. | Land | Improvement |
|---|---|---|---|---|
| 2025 | $2,288 | $194,233 | $52,638 | $141,595 |
| 2024 | $2,288 | $190,425 | $51,606 | $138,819 |
| 2023 | $2,235 | $186,693 | $50,595 | $136,098 |
| 2022 | $2,174 | $183,033 | $49,603 | $133,430 |
| 2021 | $2,158 | $179,445 | $48,631 | $130,814 |
| 2020 | $2,131 | $177,606 | $48,133 | $129,473 |
| 2019 | $2,092 | $174,125 | $47,190 | $126,935 |
| 2018 | $1,955 | $170,712 | $46,265 | $124,447 |
| 2017 | $1,907 | $167,365 | $45,358 | $122,007 |
| 2016 | $1,874 | $164,084 | $44,469 | $119,615 |
| 2015 | $1,846 | $161,621 | $43,802 | $117,819 |
| 2014 | $1,816 | $158,456 | $42,944 | $115,512 |
Source: Public Records
Map
Nearby Homes
- 1936 38 Broadway
- 2520 24 L St
- 2411 21 L St
- 1612 Bridgeview Dr
- 3635 Ash St Unit 7
- 2024 Boundary St
- 1751 39th St
- 1291 34th St Unit 23
- 1261 34th St Unit 28
- 1945 Gateway Dr
- 2237-39 Commonwealth Ave
- 2004 Crenshaw St
- 1738 33rd St
- 1919 33rd St
- 1103 33rd St
- 1020 41st St
- 1449 Edgemont St
- 821 Raven St
- 1841-43 31st St
- 3606 Maple St Unit 12
- 1545 Bridgeview Dr
- 1555 Bridgeview Dr
- 1539 Bridgeview Dr
- 1565 Bridgeview Dr
- 1580 Cactusridge St
- 1533 Bridgeview Dr
- 1570 Cactusridge St
- 1575 Bridgeview Dr
- 1590 Cactusridge St
- 1560 Cactusridge St
- 1527 Bridgeview Dr
- 1585 Bridgeview Dr
- 1550 Bridgeview Dr
- 1542 Bridgeview Dr
- 1556 Bridgeview Dr
- 1564 Bridgeview Dr
- 1536 Bridgeview Dr
- 1540 Cactusridge St
- 1521 Bridgeview Dr
- 1530 Bridgeview Dr
Your Personal Tour Guide
Ask me questions while you tour the home.