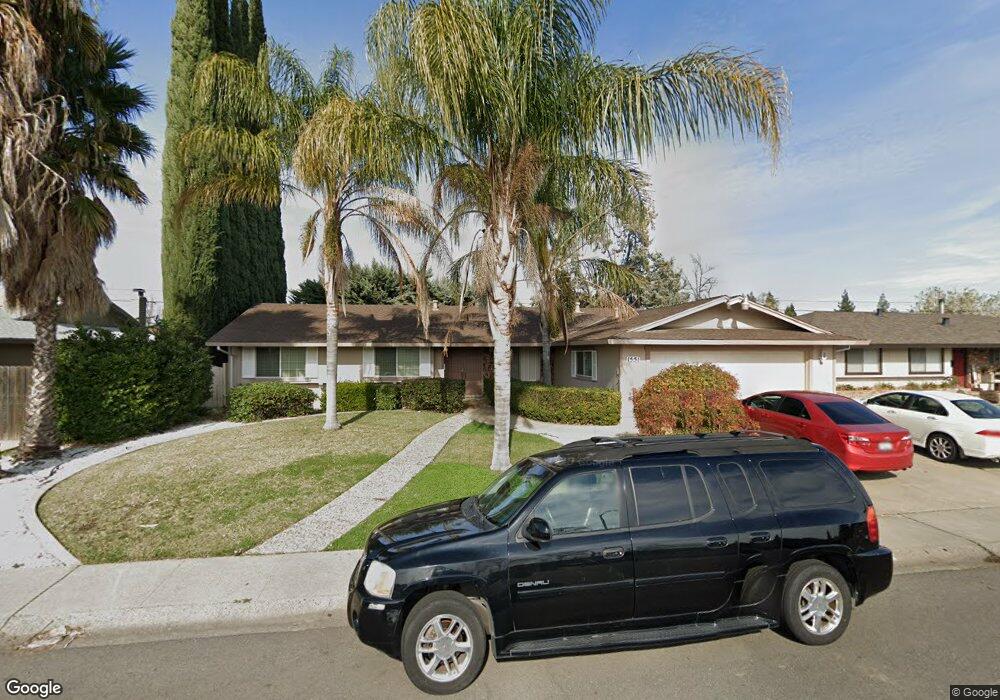
1551 Queens Ave Yuba City, CA 95993
Estimated Value: $234,000 - $401,000
3
Beds
2
Baths
1,536
Sq Ft
$231/Sq Ft
Est. Value
About This Home
This home is located at 1551 Queens Ave, Yuba City, CA 95993 and is currently estimated at $355,072, approximately $231 per square foot. 1551 Queens Ave is a home located in Sutter County with nearby schools including Butte Vista Elementary School, River Valley High School, and Pathways Charter Academy.
Ownership History
Date
Name
Owned For
Owner Type
Purchase Details
Closed on
Mar 22, 2024
Sold by
Raya Jose Luis Almanza
Bought by
Jose Luis Almanza Raya Trust and Raya
Current Estimated Value
Purchase Details
Closed on
Apr 2, 2008
Sold by
U S Bank Na
Bought by
Raya Jose Luis
Purchase Details
Closed on
Mar 6, 2008
Sold by
Gonzalez Jose
Bought by
Lehman Brothers Structured Asset Investm
Purchase Details
Closed on
Jun 10, 2005
Sold by
Gonzalez Cruz
Bought by
Gonzalez Jose
Home Financials for this Owner
Home Financials are based on the most recent Mortgage that was taken out on this home.
Original Mortgage
$252,000
Interest Rate
5.72%
Mortgage Type
Fannie Mae Freddie Mac
Create a Home Valuation Report for This Property
The Home Valuation Report is an in-depth analysis detailing your home's value as well as a comparison with similar homes in the area
Home Values in the Area
Average Home Value in this Area
Purchase History
| Date | Buyer | Sale Price | Title Company |
|---|---|---|---|
| Jose Luis Almanza Raya Trust | -- | None Listed On Document | |
| Raya Jose Luis | $130,000 | Financial Title Company | |
| Lehman Brothers Structured Asset Investm | $204,000 | Accommodation | |
| Gonzalez Jose | -- | North State Title Company | |
| Gonzalez Jose | $315,000 | North State Title Company |
Source: Public Records
Mortgage History
| Date | Status | Borrower | Loan Amount |
|---|---|---|---|
| Previous Owner | Gonzalez Jose | $252,000 | |
| Previous Owner | Gonzalez Jose | $63,000 |
Source: Public Records
Tax History Compared to Growth
Tax History
| Year | Tax Paid | Tax Assessment Tax Assessment Total Assessment is a certain percentage of the fair market value that is determined by local assessors to be the total taxable value of land and additions on the property. | Land | Improvement |
|---|---|---|---|---|
| 2025 | $1,989 | $167,391 | $64,379 | $103,012 |
| 2024 | $1,989 | $164,110 | $63,117 | $100,993 |
| 2023 | $1,989 | $160,893 | $61,880 | $99,013 |
| 2022 | $1,904 | $157,739 | $60,667 | $97,072 |
| 2021 | $1,884 | $154,661 | $59,485 | $95,176 |
| 2020 | $1,852 | $153,075 | $58,875 | $94,200 |
| 2019 | $1,814 | $150,074 | $57,721 | $92,353 |
| 2018 | $1,789 | $147,131 | $56,589 | $90,542 |
| 2017 | $1,747 | $144,245 | $55,479 | $88,766 |
| 2016 | $1,714 | $141,417 | $54,391 | $87,026 |
| 2015 | $2,030 | $139,292 | $53,574 | $85,718 |
| 2014 | $1,669 | $136,564 | $52,525 | $84,039 |
Source: Public Records
Map
Nearby Homes
- 1491 Peach Tree Ln
- 1620 Sharon Dr
- 15 La Cienega Way
- 75 La Esperanza Way
- 1571 Coats Dr
- 1441 El Dorado Ln
- 161 El Granero Way
- 175 El Verano Way
- 1370 Dustin Dr Unit 14
- 1451 Eden Way
- 1610 Corsica Dr
- 1602 Majorca Dr
- 1730 Akers Ct
- 0 Harter Pkwy
- Sevilla Plan at Domain Estates
- Barcelona Plan at Domain Estates
- Valencia Plan at Domain Estates
- 1898 Kenneth Way
- 1940 Kenneth Way
- 1227 Casita Dr Unit 2
- 1561 Queens Ave
- 1541 Queens Ave
- 1550 Peach Tree Ln
- 1560 Peach Tree Ln
- 1540 Peach Tree Ln
- 1571 Queens Ave
- 1531 Queens Ave
- 1550 Queens Ave
- 1540 Queens Ave
- 1570 Peach Tree Ln
- 1530 Peach Tree Ln
- 1560 Queens Ave
- 1530 Queens Ave
- 1581 Queens Ave
- 1521 Queens Ave
- 1570 Queens Ave
- 1551 Peach Tree Ln
- 1580 Peach Tree Ln
- 1520 Peach Tree Ln
- 1561 Peach Tree Ln