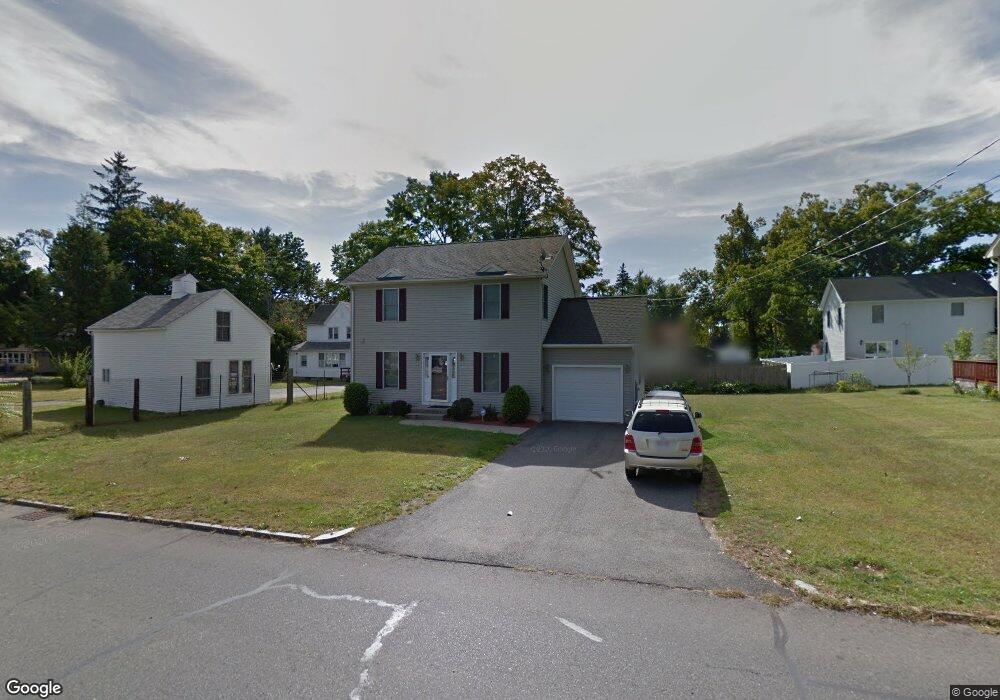
1551 Sumner Ave Springfield, MA 01118
East Forest Park NeighborhoodEstimated Value: $340,000 - $379,000
3
Beds
2
Baths
1,440
Sq Ft
$245/Sq Ft
Est. Value
About This Home
This home is located at 1551 Sumner Ave, Springfield, MA 01118 and is currently estimated at $352,629, approximately $244 per square foot. 1551 Sumner Ave is a home located in Hampden County with nearby schools including Frederick Harris Elementary School, M Marcus Kiley Middle, and Springfield High School of Science and Technology.
Ownership History
Date
Name
Owned For
Owner Type
Purchase Details
Closed on
Oct 26, 2005
Sold by
Roosevelt Hill Llc and Moltenbrey John
Bought by
Nyandebo Joseph D and Nyandebo Sarah S
Current Estimated Value
Home Financials for this Owner
Home Financials are based on the most recent Mortgage that was taken out on this home.
Original Mortgage
$168,000
Outstanding Balance
$90,639
Interest Rate
5.79%
Mortgage Type
Purchase Money Mortgage
Estimated Equity
$261,990
Create a Home Valuation Report for This Property
The Home Valuation Report is an in-depth analysis detailing your home's value as well as a comparison with similar homes in the area
Home Values in the Area
Average Home Value in this Area
Purchase History
| Date | Buyer | Sale Price | Title Company |
|---|---|---|---|
| Nyandebo Joseph D | $21,000 | -- |
Source: Public Records
Mortgage History
| Date | Status | Borrower | Loan Amount |
|---|---|---|---|
| Open | Nyandebo Joseph D | $168,000 | |
| Closed | Nyandebo Joseph D | $42,000 |
Source: Public Records
Tax History
| Year | Tax Paid | Tax Assessment Tax Assessment Total Assessment is a certain percentage of the fair market value that is determined by local assessors to be the total taxable value of land and additions on the property. | Land | Improvement |
|---|---|---|---|---|
| 2025 | $4,754 | $303,200 | $51,500 | $251,700 |
| 2024 | $5,231 | $325,700 | $51,500 | $274,200 |
| 2023 | $4,805 | $281,800 | $49,000 | $232,800 |
| 2022 | $4,381 | $232,800 | $49,000 | $183,800 |
| 2021 | $4,472 | $236,600 | $44,500 | $192,100 |
| 2020 | $4,138 | $211,900 | $44,500 | $167,400 |
| 2019 | $4,101 | $208,400 | $44,500 | $163,900 |
| 2018 | $4,152 | $211,000 | $44,500 | $166,500 |
| 2017 | $3,993 | $203,100 | $44,500 | $158,600 |
| 2016 | $3,895 | $198,100 | $44,500 | $153,600 |
| 2015 | $3,633 | $184,700 | $44,500 | $140,200 |
Source: Public Records
Map
Nearby Homes
- 55 Allen St
- 19 Manor Ct Unit 19
- 17 Pebble Mill Rd
- 101 Regal St
- 120 Bridle Path Rd
- 125 Manor Ct Unit 125
- 86 Talmadge Dr
- 85 Talmadge Dr
- 24 Wands St
- 647 Plumtree Rd
- 206 Treetop Ave
- 509 Plumtree Rd
- 81 W Crystal Brook Dr
- 41 Hillside Dr
- 37 Chesterfield Ave
- 86 Wildwood Ave
- 46 Hadley St
- 119 Powell Ave
- 47 Hartford Terrace
- 79 Arvilla St
- 1541 Sumner Ave
- 1195 Allen St
- 1187 Allen St
- 4 Green Way
- 1540 Sumner Ave
- 3 Bairdcrest Rd
- 1562 Sumner Ave
- 1 Bairdcrest Rd
- 12 Green Way Unit 5
- 12 Green Way
- 1530 Sumner Ave
- 1225 Allen St
- 1572 Sumner Ave
- 6 Corcoran Blvd
- 15 Bairdcrest Rd
- 1206 Allen St
- 1182 Allen St
- 20 Green Way
- 13 Green Way
- 25 Bairdcrest Rd
Your Personal Tour Guide
Ask me questions while you tour the home.