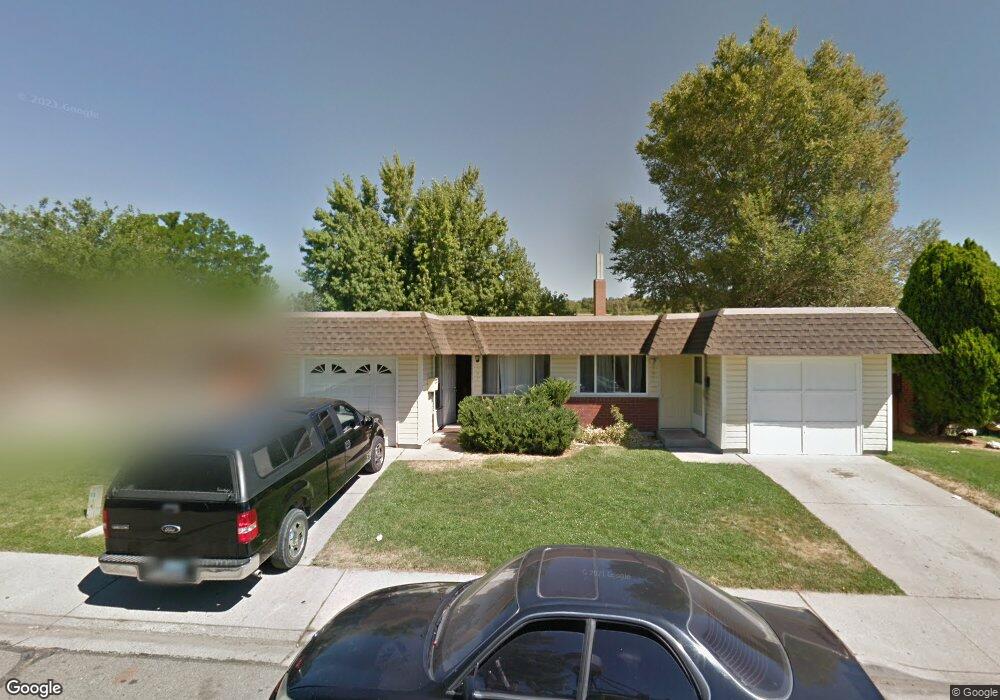
1552 Gault Way Unit B Sparks, NV 89431
North Rock NeighborhoodEstimated Value: $236,000 - $301,000
3
Beds
2
Baths
1,044
Sq Ft
$272/Sq Ft
Est. Value
About This Home
This home is located at 1552 Gault Way Unit B, Sparks, NV 89431 and is currently estimated at $283,469, approximately $271 per square foot. 1552 Gault Way Unit B is a home located in Washoe County with nearby schools including Alice Maxwell Elementary School, Sparks Middle School, and Sparks High School.
Ownership History
Date
Name
Owned For
Owner Type
Purchase Details
Closed on
Jun 23, 2010
Sold by
Parks Byron T and Parks Noelle A
Bought by
Angel Bucks Llc
Current Estimated Value
Purchase Details
Closed on
Nov 1, 2004
Sold by
Cox Albert A and Smith Adrienne T
Bought by
Parks Byron T and Parks Noelle A
Home Financials for this Owner
Home Financials are based on the most recent Mortgage that was taken out on this home.
Original Mortgage
$82,500
Interest Rate
5.79%
Mortgage Type
Unknown
Purchase Details
Closed on
Jan 15, 1999
Sold by
Cox Albert Alan and Cox Albert A
Bought by
Cox Albert A and Smith Adrienne T
Purchase Details
Closed on
Nov 10, 1993
Sold by
Smith Adrienne Trant
Bought by
Cox Albert Alan
Home Financials for this Owner
Home Financials are based on the most recent Mortgage that was taken out on this home.
Original Mortgage
$37,100
Interest Rate
6.88%
Mortgage Type
VA
Create a Home Valuation Report for This Property
The Home Valuation Report is an in-depth analysis detailing your home's value as well as a comparison with similar homes in the area
Home Values in the Area
Average Home Value in this Area
Purchase History
| Date | Buyer | Sale Price | Title Company |
|---|---|---|---|
| Angel Bucks Llc | -- | None Available | |
| Parks Byron T | $110,000 | First American Title | |
| Cox Albert A | -- | -- | |
| Cox Albert Alan | -- | Comstock Title Company |
Source: Public Records
Mortgage History
| Date | Status | Borrower | Loan Amount |
|---|---|---|---|
| Previous Owner | Parks Byron T | $82,500 | |
| Previous Owner | Cox Albert Alan | $37,100 |
Source: Public Records
Tax History Compared to Growth
Tax History
| Year | Tax Paid | Tax Assessment Tax Assessment Total Assessment is a certain percentage of the fair market value that is determined by local assessors to be the total taxable value of land and additions on the property. | Land | Improvement |
|---|---|---|---|---|
| 2025 | $687 | $38,213 | $24,633 | $13,580 |
| 2024 | $687 | $36,954 | $23,247 | $13,707 |
| 2023 | $637 | $32,201 | $20,381 | $11,821 |
| 2022 | $461 | $26,630 | $16,632 | $9,998 |
| 2021 | $547 | $20,454 | $10,647 | $9,807 |
| 2020 | $530 | $20,867 | $10,647 | $10,220 |
| 2019 | $515 | $21,116 | $10,836 | $10,280 |
| 2018 | $506 | $16,993 | $6,615 | $10,378 |
| 2017 | $486 | $16,843 | $6,384 | $10,459 |
| 2016 | $474 | $16,137 | $5,220 | $10,917 |
| 2015 | $472 | $15,657 | $4,223 | $11,434 |
| 2014 | $457 | $14,105 | $2,893 | $11,212 |
| 2013 | -- | $13,658 | $2,294 | $11,364 |
Source: Public Records
Map
Nearby Homes
- 1620 Gault Way
- 0 N Mccarran Blvd Unit 250052909
- 1731 Gault Way Unit D
- 1345 Plymouth Way
- 1595 York Way
- 1125 Dodson Way
- 3269 Valley Forge Way
- 1160 York Way
- 2154 Oppio St
- 1110 Xman Way
- 3252 Holman Way
- 1655 Byrd Dr
- 1799 Vance Way
- 5530 High Rock Way
- 1124 Sbragia Way
- 1780 Greenbrae Dr
- 780 Emerson Way
- 3516 Brassie Dr
- 1003 Sbragia Way
- 5650 Wedekind Rd
- 1560 Gault Way
- 1542 Gault Way
- 1570 Gault Way
- 1532 Gault Way Unit B
- 1572 Gault Way Unit B
- 1545 Gault Way
- 1561 Gault Way Unit F
- 1530 Gault Way
- 1563 Gault Way
- 1543 Gault Way
- 1590 Gault Way
- 1592 Gault Way Unit B
- 1522 Gault Way
- 1533 Gault Way
- 2792 16th St
- 1531 Gault Way Unit C
- 2790 16th St Unit C
- 1553 Gault Way
- 1565 Gault Way
- 1600 Gault Way Unit C