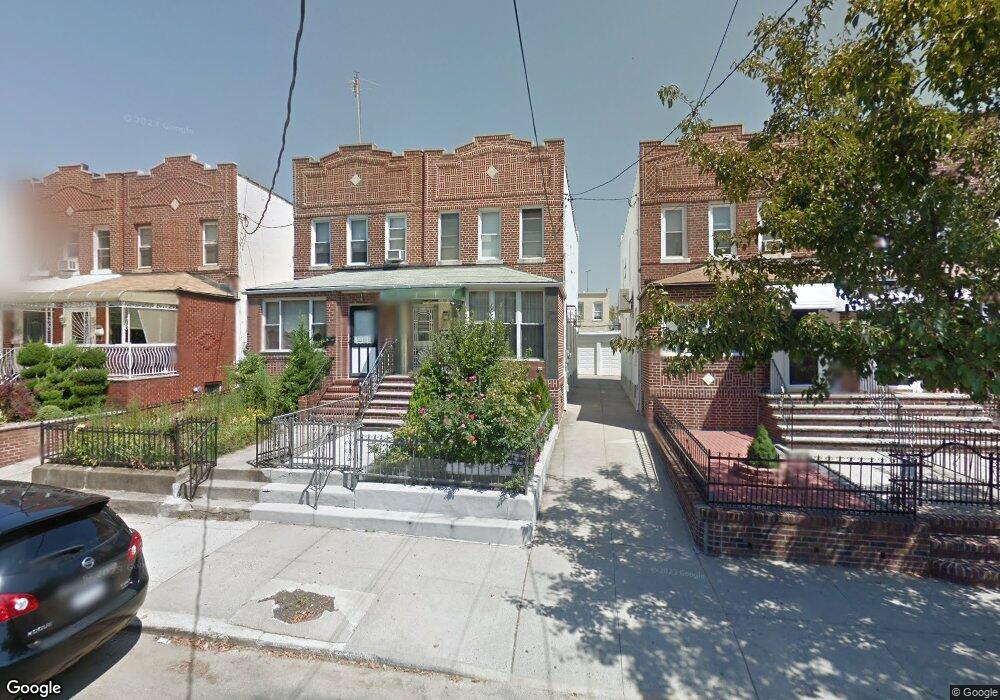
1553 78th St Brooklyn, NY 11228
Bensonhurst NeighborhoodEstimated Value: $1,072,000 - $1,529,000
Studio
--
Bath
1,440
Sq Ft
$885/Sq Ft
Est. Value
About This Home
This home is located at 1553 78th St, Brooklyn, NY 11228 and is currently estimated at $1,274,324, approximately $884 per square foot. 1553 78th St is a home located in Kings County with nearby schools including P.S. 204 Vince Lombardi, Junior High School 227 Edward B Shallow, and New Utrecht High School.
Ownership History
Date
Name
Owned For
Owner Type
Purchase Details
Closed on
Dec 23, 2015
Sold by
Tran Sun Yeh and Troung My Nga
Bought by
Su Mary
Current Estimated Value
Purchase Details
Closed on
Jun 11, 2007
Sold by
Quattrocchi Carmela and Quattrocchi Joseph
Bought by
Tran Sun Yeh and Truong My Nga
Home Financials for this Owner
Home Financials are based on the most recent Mortgage that was taken out on this home.
Original Mortgage
$120,000
Interest Rate
6.14%
Create a Home Valuation Report for This Property
The Home Valuation Report is an in-depth analysis detailing your home's value as well as a comparison with similar homes in the area
Home Values in the Area
Average Home Value in this Area
Purchase History
| Date | Buyer | Sale Price | Title Company |
|---|---|---|---|
| Su Mary | $790,000 | -- | |
| Su Mary | $790,000 | -- | |
| Tran Sun Yeh | $632,000 | -- | |
| Tran Sun Yeh | $632,000 | -- |
Source: Public Records
Mortgage History
| Date | Status | Borrower | Loan Amount |
|---|---|---|---|
| Previous Owner | Tran Sun Yeh | $120,000 | |
| Previous Owner | Tran Sun Yeh | $417,000 |
Source: Public Records
Tax History
| Year | Tax Paid | Tax Assessment Tax Assessment Total Assessment is a certain percentage of the fair market value that is determined by local assessors to be the total taxable value of land and additions on the property. | Land | Improvement |
|---|---|---|---|---|
| 2025 | $7,905 | $65,460 | $11,100 | $54,360 |
| 2024 | $7,905 | $62,340 | $11,100 | $51,240 |
| 2023 | $7,541 | $65,460 | $11,100 | $54,360 |
| 2022 | $6,994 | $57,660 | $11,100 | $46,560 |
| 2021 | $7,239 | $50,520 | $11,100 | $39,420 |
| 2020 | $3,598 | $56,580 | $11,100 | $45,480 |
| 2019 | $6,861 | $56,580 | $11,100 | $45,480 |
| 2018 | $6,308 | $30,943 | $6,417 | $24,526 |
| 2017 | $5,952 | $29,196 | $6,339 | $22,857 |
| 2016 | $5,730 | $28,663 | $6,396 | $22,267 |
| 2015 | $3,102 | $28,663 | $8,570 | $20,093 |
| 2014 | $3,102 | $27,333 | $9,809 | $17,524 |
Source: Public Records
Map
Nearby Homes
Your Personal Tour Guide
Ask me questions while you tour the home.