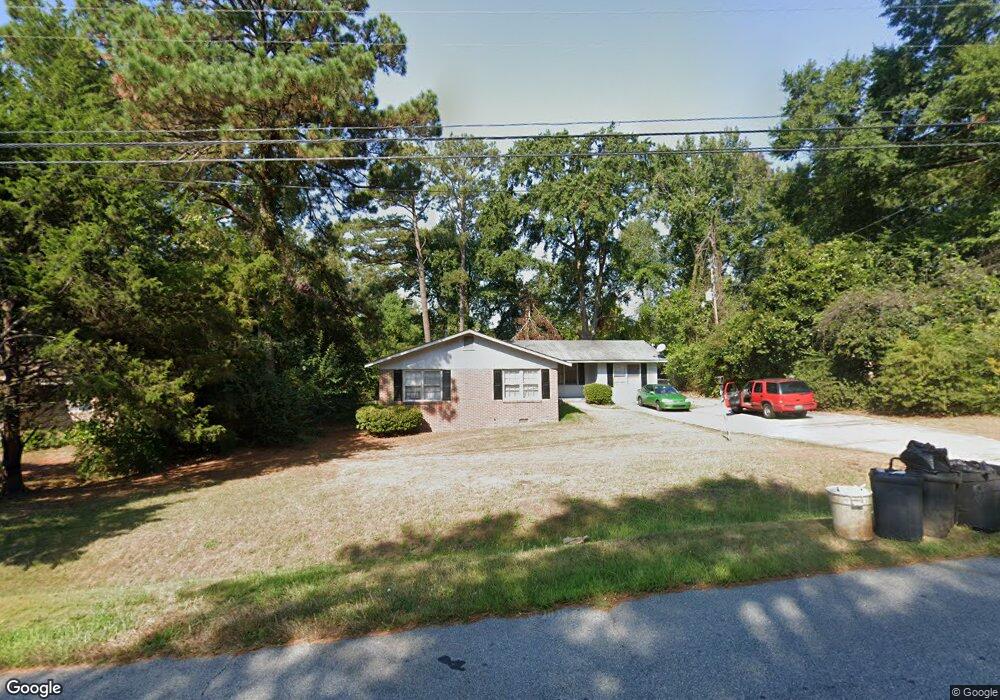
1553 Amber Dr Columbus, GA 31907
Eastern Columbus NeighborhoodEstimated Value: $155,000 - $168,451
3
Beds
3
Baths
1,504
Sq Ft
$109/Sq Ft
Est. Value
About This Home
This home is located at 1553 Amber Dr, Columbus, GA 31907 and is currently estimated at $163,363, approximately $108 per square foot. 1553 Amber Dr is a home located in Muscogee County with nearby schools including Wesley Heights Elementary School, East Columbus Magnet Academy, and Kendrick High School.
Ownership History
Date
Name
Owned For
Owner Type
Purchase Details
Closed on
Mar 24, 2021
Sold by
Blankenship Tripp
Bought by
Kudzu Holdings Llc and C/O Blalock James F
Current Estimated Value
Purchase Details
Closed on
Jan 27, 2012
Sold by
Sec Of Housing & U
Bought by
Blankenship Tripp and Blalock Jim
Purchase Details
Closed on
Oct 5, 2010
Sold by
Humphery Billy
Bought by
Pnc Bank National Association
Purchase Details
Closed on
Apr 19, 2007
Sold by
Kennon Realty Services Inc
Bought by
Humphery Billy D
Home Financials for this Owner
Home Financials are based on the most recent Mortgage that was taken out on this home.
Original Mortgage
$124,635
Interest Rate
6.1%
Mortgage Type
FHA
Create a Home Valuation Report for This Property
The Home Valuation Report is an in-depth analysis detailing your home's value as well as a comparison with similar homes in the area
Home Values in the Area
Average Home Value in this Area
Purchase History
| Date | Buyer | Sale Price | Title Company |
|---|---|---|---|
| Kudzu Holdings Llc | -- | -- | |
| Blankenship Tripp | $45,000 | -- | |
| Pnc Bank National Association | $128,245 | -- | |
| Humphery Billy D | $125,800 | None Available |
Source: Public Records
Mortgage History
| Date | Status | Borrower | Loan Amount |
|---|---|---|---|
| Previous Owner | Humphery Billy D | $124,635 |
Source: Public Records
Tax History Compared to Growth
Tax History
| Year | Tax Paid | Tax Assessment Tax Assessment Total Assessment is a certain percentage of the fair market value that is determined by local assessors to be the total taxable value of land and additions on the property. | Land | Improvement |
|---|---|---|---|---|
| 2025 | $221 | $55,105 | $8,076 | $47,029 |
| 2024 | $2,598 | $61,396 | $8,076 | $53,320 |
| 2023 | $1,763 | $61,228 | $8,076 | $53,152 |
| 2022 | $1,827 | $44,752 | $8,076 | $36,676 |
| 2021 | $1,615 | $39,556 | $8,076 | $31,480 |
| 2020 | $1,616 | $39,556 | $8,076 | $31,480 |
| 2019 | $1,621 | $39,556 | $8,076 | $31,480 |
| 2018 | $1,621 | $39,556 | $8,076 | $31,480 |
| 2017 | $1,789 | $39,556 | $8,076 | $31,480 |
| 2016 | $1,383 | $33,516 | $3,320 | $30,196 |
| 2015 | $554 | $33,516 | $3,320 | $30,196 |
| 2014 | $1,386 | $33,516 | $3,320 | $30,196 |
| 2013 | -- | $33,516 | $3,320 | $30,196 |
Source: Public Records
Map
Nearby Homes
- 5802 Blueridge Dr
- 5834 Blueridge Dr
- 6032 Cordova Rd
- 5500 Amber Dr
- 6047 Capri Cir
- 6033 Luna Dr
- 1068 Valencia Dr
- 6061 Luna Dr
- 5619 Valleybrook Rd
- 6119 Mill Branch Rd
- 6213 Fitzgerald Dr
- 5542 Teresa St
- 5920 Gleneden Dr
- 1524 Hagan Dr
- 5833 Gleneden Dr
- 5929 Gleneden Dr
- 1607 Mazor Dr
- 5828 Georgetown Dr
- 2525 Corineth Dr
- 1322 Melford Dr
- 1545 Amber Dr
- 1561 Amber Dr
- 1567 Amber Dr
- 1521 Amber Dr
- 5440 Glenview Dr
- 5447 Susan Ln
- 1554 Amber Dr
- 1546 Amber Dr
- 5768 Olivia Ln
- 5470 Glenview Dr
- 5766 Olivia Ln
- 5434 Glenview Dr
- 5443 Susan Ln
- 1538 Amber Dr
- 5428 Glenview Dr
- 5437 Susan Ln
- 1532 Amber Dr
- 5418 Glenview Dr
- 5764 Olivia Ln
- 5478 Glenview Dr