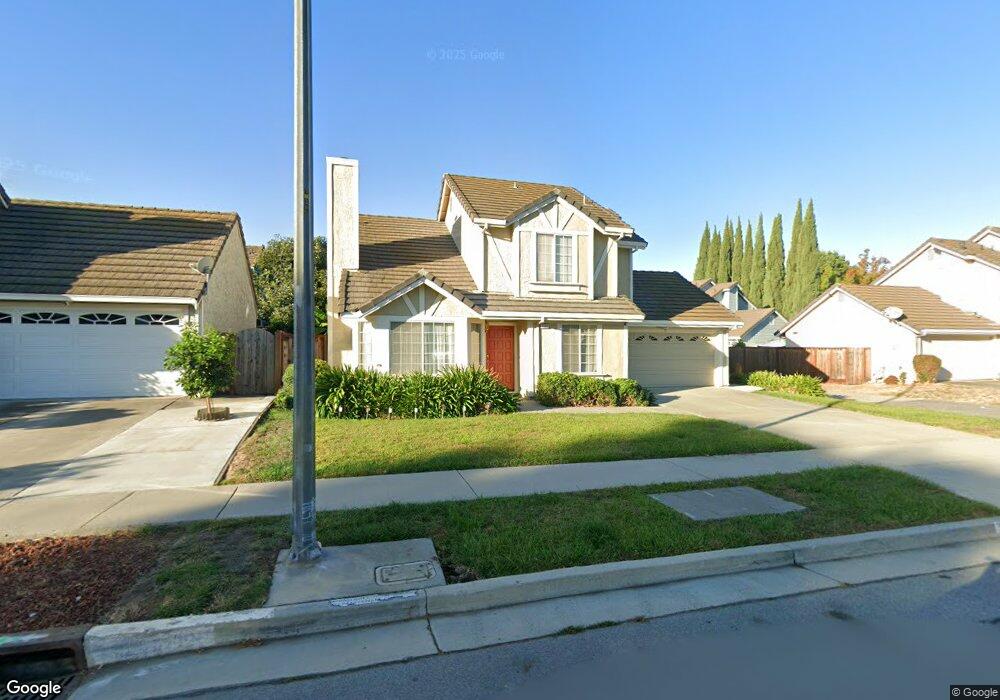
1553 Four Oaks Rd San Jose, CA 95131
Flickinger North NeighborhoodEstimated Value: $1,364,000 - $1,412,000
3
Beds
3
Baths
1,341
Sq Ft
$1,036/Sq Ft
Est. Value
About This Home
This home is located at 1553 Four Oaks Rd, San Jose, CA 95131 and is currently estimated at $1,389,238, approximately $1,035 per square foot. 1553 Four Oaks Rd is a home located in Santa Clara County with nearby schools including Brooktree Elementary School, Morrill Middle School, and Independence High School.
Ownership History
Date
Name
Owned For
Owner Type
Purchase Details
Closed on
Jul 27, 2011
Sold by
Veerabhadraswamy Ramasamudra G and Swamy Bharathi
Bought by
Veerabhadraswamy Ramasamudra G and Swamy Bharathi
Current Estimated Value
Purchase Details
Closed on
Mar 11, 1999
Sold by
Veerabhadraswamy Ramasamudra G and Swamy Bharathi
Bought by
Veerabhadraswamy Ramasamudra G and Swamy Bharathi
Home Financials for this Owner
Home Financials are based on the most recent Mortgage that was taken out on this home.
Original Mortgage
$205,000
Interest Rate
6.73%
Purchase Details
Closed on
Oct 9, 1996
Sold by
Huang James J and Chin Casie Kooi
Bought by
Veerabhadraswamy Ramasamudra G and Swamy Bharathi
Home Financials for this Owner
Home Financials are based on the most recent Mortgage that was taken out on this home.
Original Mortgage
$183,750
Interest Rate
8.37%
Mortgage Type
Balloon
Create a Home Valuation Report for This Property
The Home Valuation Report is an in-depth analysis detailing your home's value as well as a comparison with similar homes in the area
Home Values in the Area
Average Home Value in this Area
Purchase History
| Date | Buyer | Sale Price | Title Company |
|---|---|---|---|
| Veerabhadraswamy Ramasamudra G | -- | None Available | |
| Veerabhadraswamy Ramasamudra G | -- | Financial Title Company | |
| Veerabhadraswamy Ramasamudra G | $245,000 | Santa Clara Land Title Co |
Source: Public Records
Mortgage History
| Date | Status | Borrower | Loan Amount |
|---|---|---|---|
| Closed | Veerabhadraswamy Ramasamudra G | $205,000 | |
| Closed | Veerabhadraswamy Ramasamudra G | $183,750 | |
| Closed | Veerabhadraswamy Ramasamudra G | $36,750 |
Source: Public Records
Tax History Compared to Growth
Tax History
| Year | Tax Paid | Tax Assessment Tax Assessment Total Assessment is a certain percentage of the fair market value that is determined by local assessors to be the total taxable value of land and additions on the property. | Land | Improvement |
|---|---|---|---|---|
| 2025 | $6,415 | $399,004 | $211,718 | $187,286 |
| 2024 | $6,415 | $391,181 | $207,567 | $183,614 |
| 2023 | $6,276 | $383,512 | $203,498 | $180,014 |
| 2022 | $6,242 | $375,993 | $199,508 | $176,485 |
| 2021 | $6,018 | $368,622 | $195,597 | $173,025 |
| 2020 | $5,813 | $364,843 | $193,592 | $171,251 |
| 2019 | $5,587 | $357,691 | $189,797 | $167,894 |
| 2018 | $5,498 | $350,678 | $186,076 | $164,602 |
| 2017 | $5,513 | $343,803 | $182,428 | $161,375 |
| 2016 | $5,280 | $337,062 | $178,851 | $158,211 |
| 2015 | $5,212 | $332,000 | $176,165 | $155,835 |
| 2014 | $4,641 | $325,498 | $172,715 | $152,783 |
Source: Public Records
Map
Nearby Homes
- 2210 Renfrew Ct
- 1599 Clampett Way
- 2280 Zoria Cir
- 1690 Coraltree Place
- 1997 Lowney Way
- 2064 Wizard Ct
- 1968 Nutmeg Ct
- 1827 Flickinger Ave
- 1693 Peachwood Dr
- 2790 Longford Dr
- 1809 Sageland Dr
- 0 Lundy Ave
- 2520 Amaryl Dr
- 1824 Seville Way
- 1788 Camino Leonor
- 324 Morning Star Dr Unit 43
- 314 Morning Star Dr Unit 38
- 1437 Marcello Dr
- 1441 Rocklin Ct Unit 112
- 1287 Marcello Dr
- 1551 Four Oaks Rd
- 1555 Four Oaks Rd
- 1559 Four Oaks Rd
- 1552 Fujiko Dr
- 1557 Four Oaks Rd
- 1547 Four Oaks Rd
- 1548 Fujiko Dr
- 1561 Four Oaks Rd
- 1558 Timber Creek Dr
- 2203 Ladymuir Ct
- 1563 Four Oaks Rd
- 1560 Timber Creek Dr
- 1556 Timber Creek Dr
- 1562 Timber Creek Dr
- 2204 Ladymuir Ct
- 1542 Fujiko Dr
- 1564 Timber Creek Dr
- 2202 Renfrew Ct
- 1536 Timber Creek Dr
- 1554 Timber Creek Dr