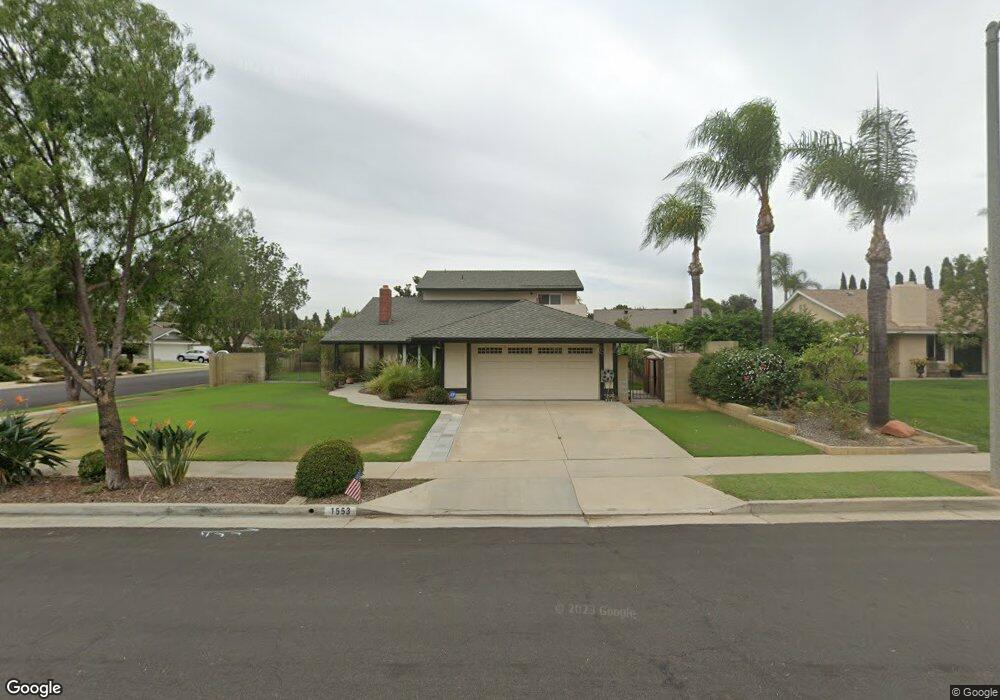
1553 Sequoia Ave Placentia, CA 92870
Estimated Value: $1,160,000 - $1,264,000
3
Beds
2
Baths
2,019
Sq Ft
$590/Sq Ft
Est. Value
About This Home
This home is located at 1553 Sequoia Ave, Placentia, CA 92870 and is currently estimated at $1,192,179, approximately $590 per square foot. 1553 Sequoia Ave is a home located in Orange County with nearby schools including Van Buren Elementary School, Kraemer Middle School, and Valencia High School.
Ownership History
Date
Name
Owned For
Owner Type
Purchase Details
Closed on
Apr 4, 2008
Sold by
Thompson David E and Thompson Ramona E
Bought by
Thompson David E and Thompson Ramona E
Current Estimated Value
Create a Home Valuation Report for This Property
The Home Valuation Report is an in-depth analysis detailing your home's value as well as a comparison with similar homes in the area
Home Values in the Area
Average Home Value in this Area
Purchase History
| Date | Buyer | Sale Price | Title Company |
|---|---|---|---|
| Thompson David E | -- | None Available |
Source: Public Records
Tax History
| Year | Tax Paid | Tax Assessment Tax Assessment Total Assessment is a certain percentage of the fair market value that is determined by local assessors to be the total taxable value of land and additions on the property. | Land | Improvement |
|---|---|---|---|---|
| 2025 | $2,352 | $134,181 | $24,722 | $109,459 |
| 2024 | $2,352 | $131,550 | $24,237 | $107,313 |
| 2023 | $2,264 | $128,971 | $23,762 | $105,209 |
| 2022 | $2,180 | $126,443 | $23,296 | $103,147 |
| 2021 | $2,086 | $123,964 | $22,839 | $101,125 |
| 2020 | $1,975 | $122,693 | $22,604 | $100,089 |
| 2019 | $1,884 | $120,288 | $22,161 | $98,127 |
| 2018 | $1,855 | $117,930 | $21,727 | $96,203 |
| 2017 | $1,819 | $115,618 | $21,301 | $94,317 |
| 2016 | $1,784 | $113,351 | $20,883 | $92,468 |
| 2015 | $1,756 | $111,649 | $20,569 | $91,080 |
| 2014 | $1,712 | $109,462 | $20,166 | $89,296 |
Source: Public Records
Map
Nearby Homes
- 1248 Carlsbad St
- 5301 Raintree St
- 17530 Monette Cir
- 1527 E Evans Ln
- 1355 Montevideo Ave
- 642 Patten Ave
- 17751 Buena Vista Ave
- 635 Patten Ave
- 17541 Pine Cir
- 623 Patten Ave
- 581 Patten Ave
- 607 Patten Ave
- 617 Patten Ave
- 603 Patten Ave
- 605 Patten Ave
- 1593 Ismail Place
- 17752 Ridgecrest Dr
- 1460 Holcomb Place Unit 23
- 1232 Woodside Dr
- 17841 Buena Vista Ave
- 1559 Sequoia Ave
- 1550 Everglade Cir
- 1556 Everglade Cir
- 1007 Yosemite Dr
- 1001 Yosemite Dr
- 1550 Sequoia Ave
- 1565 Sequoia Ave
- 1556 Sequoia Ave
- 1013 Yosemite Dr
- 919 Yosemite Dr
- 1562 Everglade Cir
- 1019 Yosemite Dr
- 1562 Sequoia Ave
- 913 Yosemite Dr
- 1571 Sequoia Ave
- 906 Yosemite Dr
- 1568 Everglade Cir
- 1553 Everglade Cir
- 912 Mammoth Way
- 1012 Mammoth Way
Your Personal Tour Guide
Ask me questions while you tour the home.