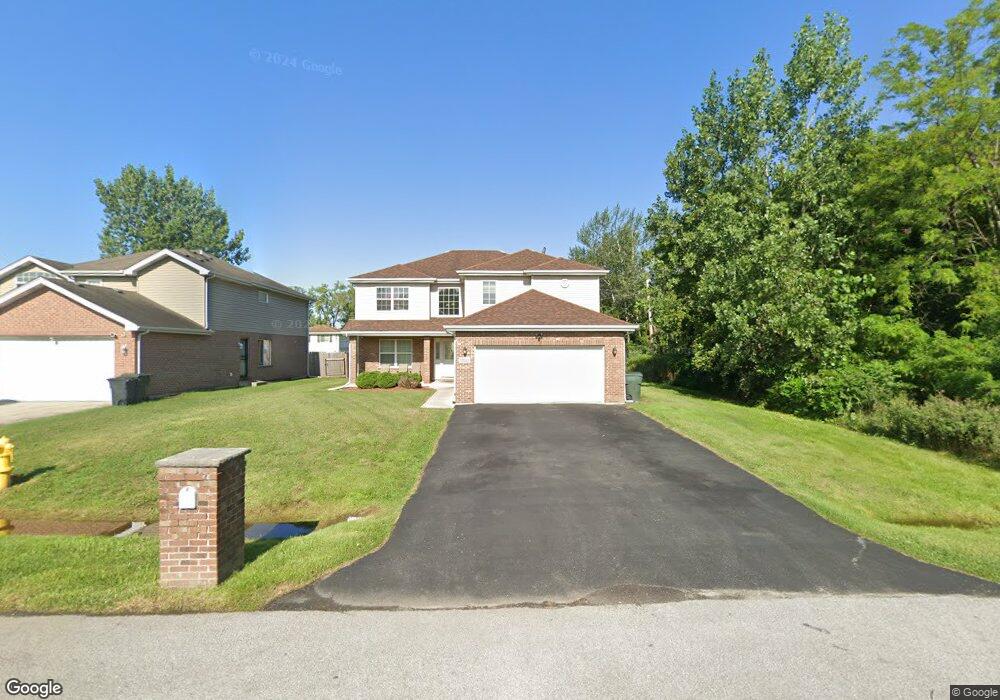
15532 Turner Ave Markham, IL 60428
Estimated Value: $211,000 - $262,000
5
Beds
3
Baths
2,583
Sq Ft
$95/Sq Ft
Est. Value
About This Home
This home is located at 15532 Turner Ave, Markham, IL 60428 and is currently estimated at $244,957, approximately $94 per square foot. 15532 Turner Ave is a home located in Cook County with nearby schools including Mae Jemison School, Prairie-Hills Junior High School, and Bremen High School.
Ownership History
Date
Name
Owned For
Owner Type
Purchase Details
Closed on
Sep 24, 2012
Sold by
First Bank Na
Bought by
Mylick Irving
Current Estimated Value
Home Financials for this Owner
Home Financials are based on the most recent Mortgage that was taken out on this home.
Original Mortgage
$149,785
Interest Rate
3.5%
Mortgage Type
VA
Purchase Details
Closed on
Dec 18, 2007
Sold by
Kuras Matthew A and Foy Scott C
Bought by
Foy Scott C and Gerdes Jeffrey Scott
Purchase Details
Closed on
Apr 6, 2007
Sold by
Mahone Builders Inc
Bought by
Kuras Matthew A and Foy Scott C
Home Financials for this Owner
Home Financials are based on the most recent Mortgage that was taken out on this home.
Original Mortgage
$155,000
Interest Rate
6.19%
Mortgage Type
Unknown
Purchase Details
Closed on
Oct 24, 2006
Sold by
Natural Land Institute
Bought by
Mahone Builders Inc
Create a Home Valuation Report for This Property
The Home Valuation Report is an in-depth analysis detailing your home's value as well as a comparison with similar homes in the area
Home Values in the Area
Average Home Value in this Area
Purchase History
| Date | Buyer | Sale Price | Title Company |
|---|---|---|---|
| Mylick Irving | $145,000 | None Available | |
| Foy Scott C | -- | None Available | |
| Kuras Matthew A | $255,000 | Git | |
| Mahone Builders Inc | $101,000 | None Available |
Source: Public Records
Mortgage History
| Date | Status | Borrower | Loan Amount |
|---|---|---|---|
| Previous Owner | Mylick Irving | $149,785 | |
| Previous Owner | Kuras Matthew A | $155,000 |
Source: Public Records
Tax History
| Year | Tax Paid | Tax Assessment Tax Assessment Total Assessment is a certain percentage of the fair market value that is determined by local assessors to be the total taxable value of land and additions on the property. | Land | Improvement |
|---|---|---|---|---|
| 2025 | $6,264 | $12,500 | $835 | $11,665 |
| 2024 | $6,264 | $12,500 | $835 | $11,665 |
| 2023 | $5,664 | $12,500 | $835 | $11,665 |
| 2022 | $5,664 | $8,646 | $742 | $7,904 |
| 2021 | $5,524 | $8,645 | $742 | $7,903 |
| 2020 | $5,486 | $8,645 | $742 | $7,903 |
| 2019 | $6,515 | $10,545 | $649 | $9,896 |
| 2018 | $6,300 | $10,545 | $649 | $9,896 |
| 2017 | $5,984 | $10,545 | $649 | $9,896 |
| 2016 | $5,466 | $9,243 | $556 | $8,687 |
| 2015 | $5,826 | $9,243 | $556 | $8,687 |
| 2014 | $5,837 | $9,243 | $556 | $8,687 |
| 2013 | $5,253 | $9,141 | $556 | $8,585 |
Source: Public Records
Map
Nearby Homes
- 15525 Homan Ave
- 15515 Homan Ave
- 15511 Homan Ave
- 15503 Homan Ave
- 15516 Frontage Rd
- 3451 W 155th St
- 15725 Kedzie Ave Unit 9
- 3314 Willow Ln
- 15742 Central Park Ave
- 15433 Crocket Ln
- 15531 Millard Ave
- 15826 Central Park Ave
- 15319 Cherry Ln
- 15333 Cherry Ln
- 3330 Roesner Dr
- 15313 Cherry Ln
- 15622 Millard Ave
- 15330 Cherry Ln
- 15246 Calitonia Dr
- 15514 Ridgeway Ave
- 15532 Turner Ave
- 15532 Turner Ave
- 15536 Turner Ave
- 15536 Turner Ave
- 15531 Homan Ave
- 15525 Homan Ave
- 15535 Homan Ave Unit 15545
- 15535 Homan Ave
- 15544 Turner Ave
- 15544 Turner Ave
- 15540 Turner Ave
- 15527 Homan Ave
- 15523 Homan Ave
- 15549 Homan Ave
- 15549 Homan Ave
- 15552 Turner Ave
- 15555 Homan Ave
- 15555 Homan Ave
- 3345 W 155th St
- 15601 Homan Ave
Your Personal Tour Guide
Ask me questions while you tour the home.