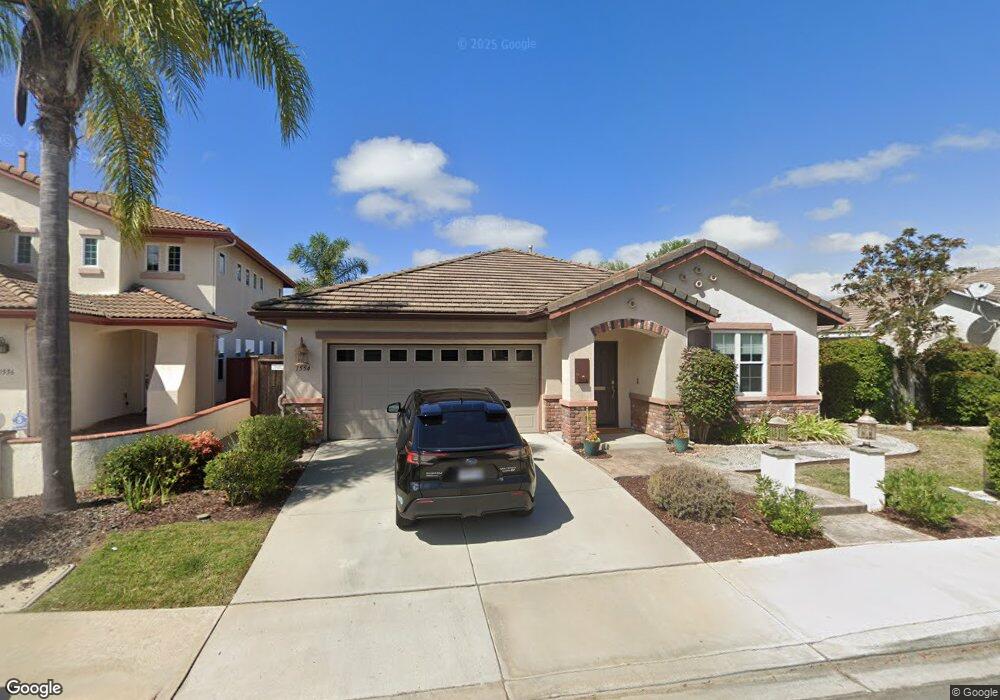
1554 Loma Alta San Marcos, CA 92069
Estimated Value: $1,021,000 - $1,130,000
3
Beds
2
Baths
2,006
Sq Ft
$535/Sq Ft
Est. Value
About This Home
This home is located at 1554 Loma Alta, San Marcos, CA 92069 and is currently estimated at $1,074,107, approximately $535 per square foot. 1554 Loma Alta is a home located in San Diego County with nearby schools including Paloma Elementary School, San Marcos Middle School, and Mission Hills High School.
Ownership History
Date
Name
Owned For
Owner Type
Purchase Details
Closed on
Mar 7, 2013
Sold by
Lee Wen Ching and Liu Mei Yu
Bought by
Brown Bradley A and Brown Whitney B
Current Estimated Value
Home Financials for this Owner
Home Financials are based on the most recent Mortgage that was taken out on this home.
Original Mortgage
$427,400
Interest Rate
3.51%
Mortgage Type
New Conventional
Purchase Details
Closed on
Nov 25, 2009
Sold by
Us Bank Na
Bought by
Lee Wen Ching and Liu Mei Yu
Purchase Details
Closed on
Sep 10, 2009
Sold by
Corbett Kathleen
Bought by
Us Bank Na
Purchase Details
Closed on
Sep 8, 2004
Sold by
Loma Alta Investors Llc
Bought by
Corbett Kathleen
Home Financials for this Owner
Home Financials are based on the most recent Mortgage that was taken out on this home.
Original Mortgage
$466,000
Interest Rate
5.5%
Mortgage Type
New Conventional
Create a Home Valuation Report for This Property
The Home Valuation Report is an in-depth analysis detailing your home's value as well as a comparison with similar homes in the area
Home Values in the Area
Average Home Value in this Area
Purchase History
| Date | Buyer | Sale Price | Title Company |
|---|---|---|---|
| Brown Bradley A | $480,000 | First American Title | |
| Lee Wen Ching | $385,000 | Landsafe Title | |
| Us Bank Na | $323,100 | Landsafe Title | |
| Corbett Kathleen | $616,000 | Chicago Title Co |
Source: Public Records
Mortgage History
| Date | Status | Borrower | Loan Amount |
|---|---|---|---|
| Previous Owner | Brown Bradley A | $427,400 | |
| Previous Owner | Corbett Kathleen | $466,000 |
Source: Public Records
Tax History Compared to Growth
Tax History
| Year | Tax Paid | Tax Assessment Tax Assessment Total Assessment is a certain percentage of the fair market value that is determined by local assessors to be the total taxable value of land and additions on the property. | Land | Improvement |
|---|---|---|---|---|
| 2025 | $9,678 | $591,073 | $207,257 | $383,816 |
| 2024 | $9,678 | $579,485 | $203,194 | $376,291 |
| 2023 | $9,508 | $568,123 | $199,210 | $368,913 |
| 2022 | $9,354 | $556,984 | $195,304 | $361,680 |
| 2021 | $8,967 | $546,064 | $191,475 | $354,589 |
| 2020 | $8,870 | $540,466 | $189,512 | $350,954 |
| 2019 | $8,765 | $529,870 | $185,797 | $344,073 |
| 2018 | $8,543 | $519,481 | $182,154 | $337,327 |
| 2017 | $8,391 | $509,296 | $178,583 | $330,713 |
| 2016 | $8,275 | $499,311 | $175,082 | $324,229 |
| 2015 | $8,185 | $491,812 | $172,453 | $319,359 |
| 2014 | $8,056 | $482,179 | $169,075 | $313,104 |
Source: Public Records
Map
Nearby Homes
- 1682 Saddlehorn Dr
- 1387 Avenida Azul
- 710 Casita Ln
- 1751 Avenida Regina
- 507 Avenida Blanco
- 743 Avenida Leon
- 3511 Badillo Rd
- 155 Las Flores Dr Unit 36
- 155 Las Flores Dr Unit 136
- 155 Las Flores Dr Unit 25
- 3435 Capalina Rd Unit 10
- 302 N Pacific St
- 2907 S Santa fe Ave Unit 10
- 2907 S Santa fe Ave Unit 64
- 1515 Capalina Rd Unit 42
- 1515 Capalina Rd Unit 71
- 1802 Saltbush Dr
- 2005 Saltbush Dr
- 1344 Corte Lira
- 2207 Saltbush Dr