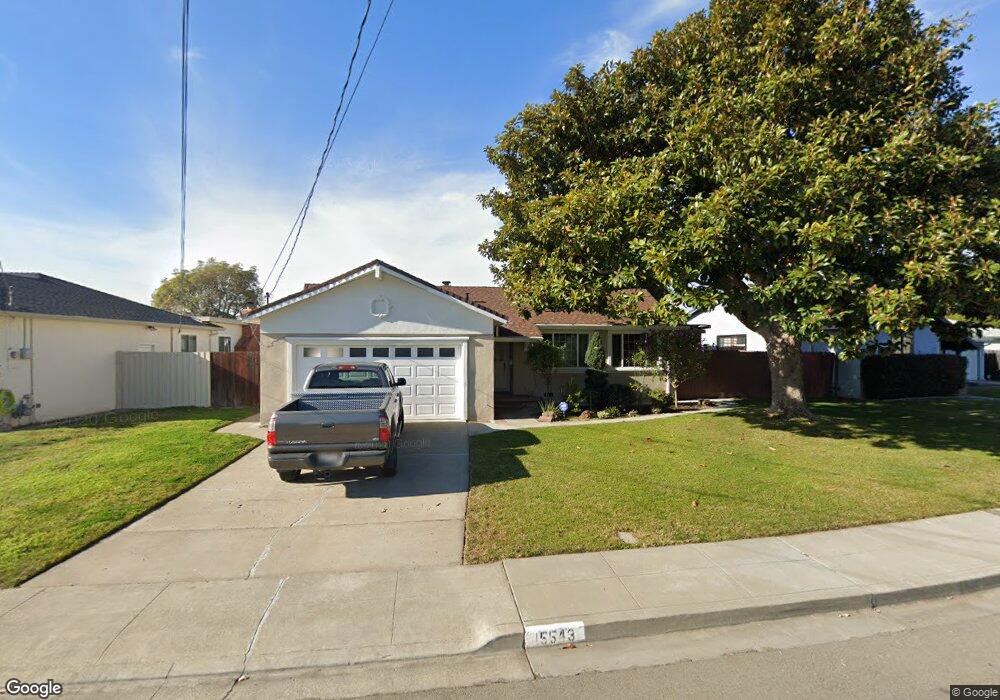
15543 Via Vega San Lorenzo, CA 94580
Estimated Value: $803,000 - $909,000
3
Beds
2
Baths
1,403
Sq Ft
$618/Sq Ft
Est. Value
About This Home
This home is located at 15543 Via Vega, San Lorenzo, CA 94580 and is currently estimated at $867,619, approximately $618 per square foot. 15543 Via Vega is a home located in Alameda County with nearby schools including Grant Elementary School, Washington Manor Middle School, and Arroyo High School.
Ownership History
Date
Name
Owned For
Owner Type
Purchase Details
Closed on
Nov 7, 2003
Sold by
Donalaya Christina and Robert E Stanton Revocable Tru
Bought by
Jimenez Jesus D and Jimenez Della A
Current Estimated Value
Home Financials for this Owner
Home Financials are based on the most recent Mortgage that was taken out on this home.
Original Mortgage
$328,000
Outstanding Balance
$144,098
Interest Rate
5.25%
Mortgage Type
Purchase Money Mortgage
Estimated Equity
$723,521
Purchase Details
Closed on
Jan 16, 2002
Sold by
Stanton Robert E
Bought by
Stanton Robert and The Robert E Stanton Revocable
Purchase Details
Closed on
Jun 1, 1999
Sold by
Stanton Robert E
Bought by
Stanton Robert E and Donalaya Christine
Create a Home Valuation Report for This Property
The Home Valuation Report is an in-depth analysis detailing your home's value as well as a comparison with similar homes in the area
Home Values in the Area
Average Home Value in this Area
Purchase History
| Date | Buyer | Sale Price | Title Company |
|---|---|---|---|
| Jimenez Jesus D | $410,000 | Placer Title Company | |
| Stanton Robert | -- | -- | |
| Stanton Robert E | -- | -- |
Source: Public Records
Mortgage History
| Date | Status | Borrower | Loan Amount |
|---|---|---|---|
| Open | Jimenez Jesus D | $328,000 |
Source: Public Records
Tax History Compared to Growth
Tax History
| Year | Tax Paid | Tax Assessment Tax Assessment Total Assessment is a certain percentage of the fair market value that is determined by local assessors to be the total taxable value of land and additions on the property. | Land | Improvement |
|---|---|---|---|---|
| 2025 | $7,497 | $575,900 | $174,870 | $408,030 |
| 2024 | $7,497 | $564,474 | $171,442 | $400,032 |
| 2023 | $7,458 | $560,268 | $168,080 | $392,188 |
| 2022 | $7,349 | $542,284 | $164,785 | $384,499 |
| 2021 | $7,148 | $531,518 | $161,555 | $376,963 |
| 2020 | $6,996 | $533,000 | $159,900 | $373,100 |
| 2019 | $7,007 | $522,548 | $156,764 | $365,784 |
| 2018 | $6,628 | $512,302 | $153,690 | $358,612 |
| 2017 | $6,324 | $502,257 | $150,677 | $351,580 |
| 2016 | $6,034 | $492,410 | $147,723 | $344,687 |
| 2015 | $5,903 | $485,013 | $145,504 | $339,509 |
| 2014 | $5,582 | $455,000 | $136,500 | $318,500 |
Source: Public Records
Map
Nearby Homes
- 840 Woodgate Dr
- 987 Via Bregani
- 874 Lewelling Blvd
- 15535 Sedgeman St
- 747 Lewelling Blvd
- 747 Lewelling Blvd Unit SPC 22
- 15356 Sullivan Ave
- 670 Fargo Ave Unit 5
- 720 Fargo Ave Unit 14
- 638 Paseo Del Rio
- 700 Fargo Ave Unit 12
- 700 Fargo Ave Unit 5
- 700 Fargo Ave Unit 2
- 700 Fargo Ave Unit 1
- 650 Fargo Ave Unit 4
- 15382 Andover St
- 15822 Devonwood Way
- 0 E 14th St Unit 41059501
- 619 Beatrice St
- 15049 Kesterson St
- 15551 Via Vega
- 15529 Via Vega
- 896 Via Bregani
- 888 Via Bregani
- 15559 Via Vega
- 904 Via Bregani
- 874 Via Bregani
- 15550 Via Vega
- 15534 Via Vega
- 15542 Via Vega
- 912 Via Bregani
- 15526 Via Vega
- 872 Via Bregani
- 15567 Via Vega
- 15574 Via Vega
- 15518 Via Vega
- 920 Via Bregani
- 895 Via Bregani
- 887 Via Bregani
- 15510 Via Vega