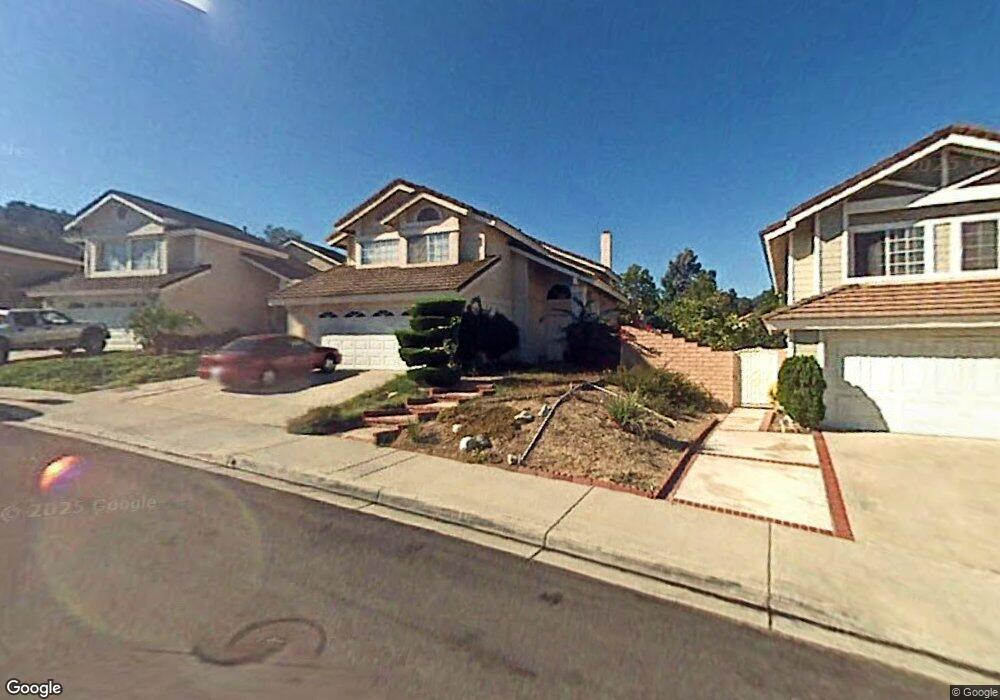
15548 Ficus St Chino Hills, CA 91709
South Chino Hills NeighborhoodEstimated Value: $986,872 - $1,098,000
4
Beds
3
Baths
2,065
Sq Ft
$507/Sq Ft
Est. Value
About This Home
This home is located at 15548 Ficus St, Chino Hills, CA 91709 and is currently estimated at $1,046,218, approximately $506 per square foot. 15548 Ficus St is a home located in San Bernardino County with nearby schools including Oak Ridge Elementary School, Robert O. Townsend Junior High School, and Chino Hills High School.
Ownership History
Date
Name
Owned For
Owner Type
Purchase Details
Closed on
May 26, 2017
Sold by
Yard Randy
Bought by
Yard Randy J and Yard Catherine S
Current Estimated Value
Create a Home Valuation Report for This Property
The Home Valuation Report is an in-depth analysis detailing your home's value as well as a comparison with similar homes in the area
Home Values in the Area
Average Home Value in this Area
Purchase History
| Date | Buyer | Sale Price | Title Company |
|---|---|---|---|
| Yard Randy J | -- | None Available |
Source: Public Records
Tax History Compared to Growth
Tax History
| Year | Tax Paid | Tax Assessment Tax Assessment Total Assessment is a certain percentage of the fair market value that is determined by local assessors to be the total taxable value of land and additions on the property. | Land | Improvement |
|---|---|---|---|---|
| 2025 | $4,368 | $355,401 | $124,478 | $230,923 |
| 2024 | $4,368 | $348,432 | $122,037 | $226,395 |
| 2023 | $4,261 | $341,600 | $119,644 | $221,956 |
| 2022 | $4,239 | $334,902 | $117,298 | $217,604 |
| 2021 | $4,166 | $328,335 | $114,998 | $213,337 |
| 2020 | $4,042 | $324,968 | $113,819 | $211,149 |
| 2019 | $3,978 | $318,596 | $111,587 | $207,009 |
| 2018 | $3,900 | $312,349 | $109,399 | $202,950 |
| 2017 | $3,838 | $306,225 | $107,254 | $198,971 |
| 2016 | $3,618 | $300,221 | $105,151 | $195,070 |
| 2015 | $3,555 | $295,712 | $103,572 | $192,140 |
| 2014 | $3,493 | $289,919 | $101,543 | $188,376 |
Source: Public Records
Map
Nearby Homes
- 15520 Ficus St
- 2918 Crape Myrtle Cir
- 0 Valle Vista Dr
- 15531 Oakflats Rd
- 3099 Oaktrail Rd
- 15526 Oakhurst St
- 15770 Pistachio St
- 3107 Morningside Dr
- 3072 Crape Myrtle Cir
- 3027 Spyglass Ct
- 15358 Morningside Dr
- 15413 Oakgrove Ct
- 15740 Willow Run Dr
- 15507 Oakdale Rd
- 3150 Oakcrest Dr
- 15050 Avenida de Las Flores
- 15036 Calle la Paloma
- 2222 Carbon Canyon Rd
- 15429 Turquoise Cir N
- 2702 Avenida Marguerite
- 15552 Ficus St
- 15544 Ficus St
- 15556 Ficus St
- 15540 Ficus St
- 15560 Ficus St
- 15553 Ficus St
- 15545 Ficus St
- 15536 Ficus St
- 15557 Ficus St
- 15537 Ficus St
- 15593 Quiet Oak Dr
- 15532 Ficus St
- 15561 Ficus St
- 15599 Quiet Oak Dr
- 15581 Quiet Oak Dr
- 15564 Ficus St
- 15529 Ficus St
- 15565 Ficus St Unit 91710
- 15528 Ficus St
- 15569 Quiet Oak Dr