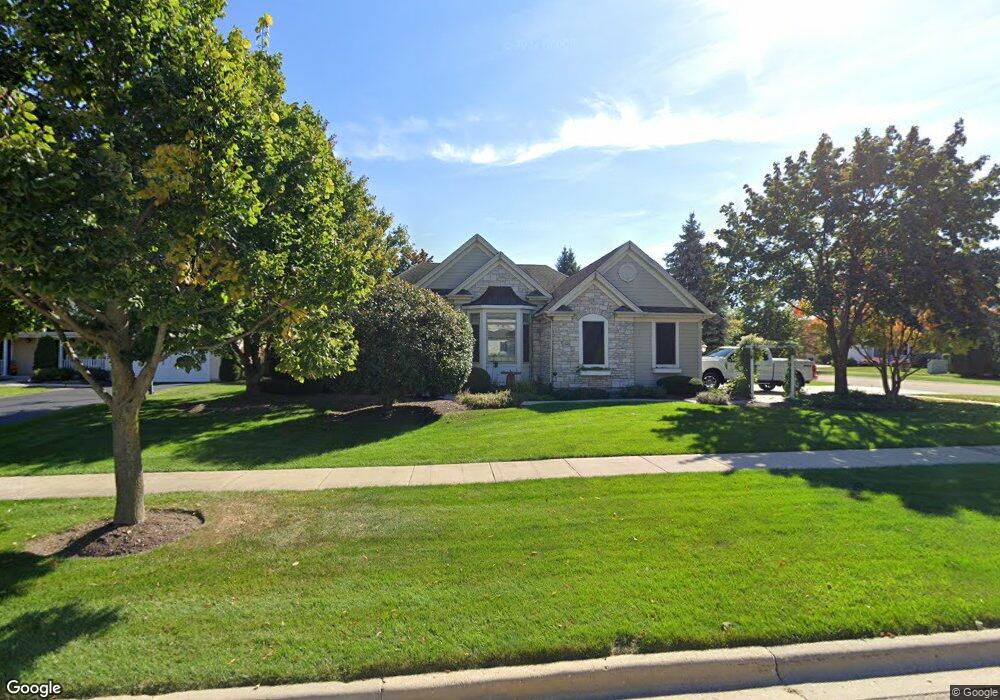
1555 Anderson Rd Elburn, IL 60119
Estimated Value: $485,000 - $609,000
5
Beds
3
Baths
2,800
Sq Ft
$201/Sq Ft
Est. Value
About This Home
This home is located at 1555 Anderson Rd, Elburn, IL 60119 and is currently estimated at $561,935, approximately $200 per square foot. 1555 Anderson Rd is a home located in Kane County with nearby schools including Kaneland Blackberry Creek Elementary School, Harter Middle School, and Kaneland Senior High School.
Ownership History
Date
Name
Owned For
Owner Type
Purchase Details
Closed on
Jun 20, 2017
Sold by
Ryder Ii Thomas R
Bought by
Shirley Matthew B and Shirley Jennifer G
Current Estimated Value
Home Financials for this Owner
Home Financials are based on the most recent Mortgage that was taken out on this home.
Original Mortgage
$377,500
Outstanding Balance
$314,259
Interest Rate
4.05%
Mortgage Type
New Conventional
Estimated Equity
$247,676
Purchase Details
Closed on
Aug 24, 2016
Sold by
Ryder Thomas R
Bought by
Ryder Ii Thomas R and Thomas R Ryder Ii Living Trust
Purchase Details
Closed on
Oct 18, 2006
Sold by
Dupage National Bank
Bought by
Ryder Thomas R
Home Financials for this Owner
Home Financials are based on the most recent Mortgage that was taken out on this home.
Original Mortgage
$355,000
Interest Rate
6%
Mortgage Type
Purchase Money Mortgage
Create a Home Valuation Report for This Property
The Home Valuation Report is an in-depth analysis detailing your home's value as well as a comparison with similar homes in the area
Home Values in the Area
Average Home Value in this Area
Purchase History
| Date | Buyer | Sale Price | Title Company |
|---|---|---|---|
| Shirley Matthew B | $400,000 | Chicago Title Insurance Co | |
| Ryder Ii Thomas R | -- | None Available | |
| Ryder Thomas R | $500,000 | Chicago Title Insurance Co |
Source: Public Records
Mortgage History
| Date | Status | Borrower | Loan Amount |
|---|---|---|---|
| Open | Shirley Matthew B | $377,500 | |
| Previous Owner | Ryder Thomas R | $355,000 |
Source: Public Records
Tax History Compared to Growth
Tax History
| Year | Tax Paid | Tax Assessment Tax Assessment Total Assessment is a certain percentage of the fair market value that is determined by local assessors to be the total taxable value of land and additions on the property. | Land | Improvement |
|---|---|---|---|---|
| 2024 | $13,072 | $160,663 | $18,292 | $142,371 |
| 2023 | $12,608 | $145,003 | $16,509 | $128,494 |
| 2022 | $12,106 | $133,617 | $15,151 | $118,466 |
| 2021 | $11,668 | $127,561 | $14,501 | $113,060 |
| 2020 | $11,458 | $124,571 | $14,161 | $110,410 |
| 2019 | $11,466 | $122,742 | $13,953 | $108,789 |
| 2018 | $11,372 | $119,533 | $13,953 | $105,580 |
| 2017 | $11,376 | $118,174 | $13,794 | $104,380 |
| 2016 | $11,712 | $118,299 | $13,430 | $104,869 |
| 2015 | -- | $105,785 | $9,703 | $96,082 |
| 2014 | -- | $95,247 | $11,167 | $84,080 |
| 2013 | -- | $95,247 | $11,167 | $84,080 |
Source: Public Records
Map
Nearby Homes
- 1473 Anderson Rd
- 1121 Lance Ave
- 1192 Beed Ave
- 1122 Motz St
- 951 Kindberg Ct
- 1311 Spalding Ave
- 43W556 Kenmar Ct
- 1382 Independence Ave
- 1430 Souders Ave
- 1133 Sears Cir
- 1622 Fairfield Dr
- ES Aspen Plan at Elburn Station - The Village Homes
- ES Potomac Plan at Elburn Station - The Village Homes
- ES Mackinaw Plan at Elburn Station - The Village Homes
- ES Frisco Plan at Elburn Station - The Village Homes
- 607 Virginia St
- 645 Virginia St
- 816 Simpson Ave
- LOT 7 Rowe Rd
- 44W700 Rowe Rd
- 1537 Anderson Rd
- 1580 Melbourne St
- 1513 Anderson Rd
- 1560 Melbourne St
- 811 Independence Ave Unit 2
- 823 Independence Ave
- 1540 Melbourne St
- 776 Independence Ave Unit 2
- 1501 Anderson Rd
- 1502 Anderson Rd
- 835 Independence Ave Unit 2
- 1520 Melbourne St Unit 2
- 1496 Anderson Rd
- 1491 Anderson Rd Unit 2
- 771 Independence Ave
- 1583 Melbourne St
- 847 Independence Ave Unit 2
- 1571 Melbourne St
- 1500 Melbourne St
- 1557 Melbourne St