Estimated Value: $409,044 - $456,000
4
Beds
3
Baths
2,574
Sq Ft
$168/Sq Ft
Est. Value
About This Home
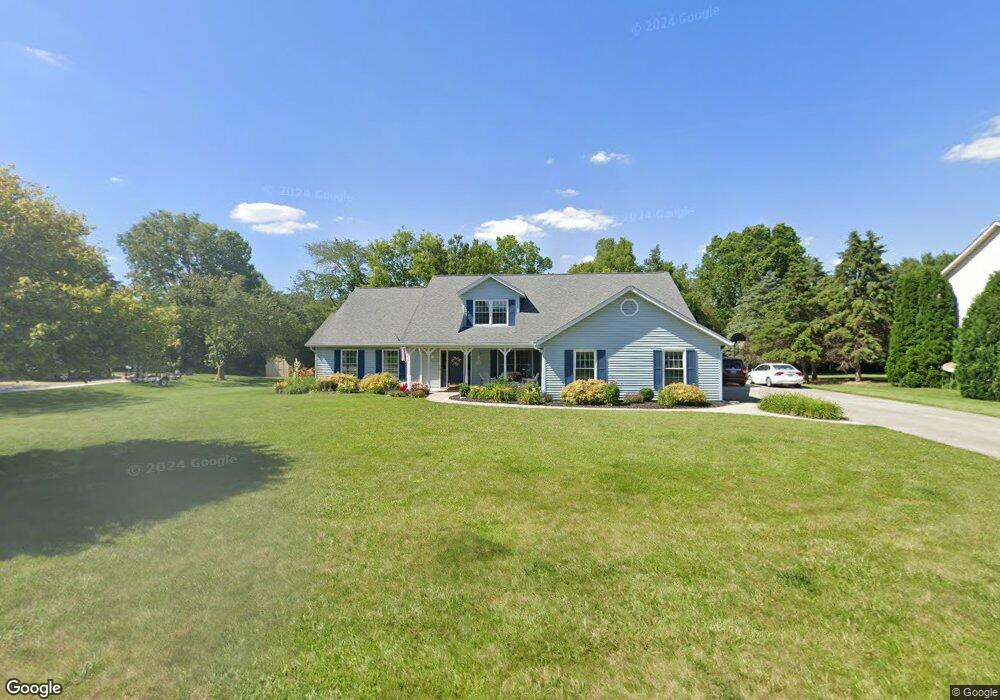
This home is located at 1555 Fox Run, Troy, OH 45373 and is currently estimated at $431,761, approximately $167 per square foot. 1555 Fox Run is a home located in Miami County with nearby schools including Concord Elementary School, Van Cleve Elementary School, and Troy Junior High School.
Ownership History
Date
Name
Owned For
Owner Type
Purchase Details
Closed on
Aug 18, 2006
Sold by
Pennybacker Ronald F and Pennybacker Cynthia
Bought by
Canavan Troy E and Canavan Christy L
Current Estimated Value
Home Financials for this Owner
Home Financials are based on the most recent Mortgage that was taken out on this home.
Original Mortgage
$199,500
Outstanding Balance
$117,095
Interest Rate
6.83%
Mortgage Type
New Conventional
Estimated Equity
$314,666
Purchase Details
Closed on
Feb 19, 2003
Sold by
U S Bank Na
Bought by
Pennybacker Ronald F and Pennybacker Cynthia J
Home Financials for this Owner
Home Financials are based on the most recent Mortgage that was taken out on this home.
Original Mortgage
$139,200
Interest Rate
6.06%
Mortgage Type
New Conventional
Purchase Details
Closed on
Jun 7, 2002
Sold by
Glodick Joseph
Bought by
Firstar Bank Na
Purchase Details
Closed on
Oct 1, 1987
Bought by
Glodick Joseph
Create a Home Valuation Report for This Property
The Home Valuation Report is an in-depth analysis detailing your home's value as well as a comparison with similar homes in the area
Purchase History
| Date | Buyer | Sale Price | Title Company |
|---|---|---|---|
| Canavan Troy E | $210,000 | -- | |
| Pennybacker Ronald F | $174,000 | -- | |
| Firstar Bank Na | $145,000 | -- | |
| Glodick Joseph | $25,000 | -- |
Source: Public Records
Mortgage History
| Date | Status | Borrower | Loan Amount |
|---|---|---|---|
| Open | Firstar Bank Na | $199,500 | |
| Previous Owner | Firstar Bank Na | $139,200 |
Source: Public Records
Tax History
| Year | Tax Paid | Tax Assessment Tax Assessment Total Assessment is a certain percentage of the fair market value that is determined by local assessors to be the total taxable value of land and additions on the property. | Land | Improvement |
|---|---|---|---|---|
| 2025 | $4,687 | $131,470 | $20,690 | $110,780 |
| 2024 | $4,687 | $103,610 | $21,530 | $82,080 |
| 2023 | $4,027 | $103,610 | $21,530 | $82,080 |
| 2022 | $3,374 | $103,610 | $21,530 | $82,080 |
| 2021 | $2,875 | $82,880 | $17,220 | $65,660 |
| 2020 | $2,878 | $82,880 | $17,220 | $65,660 |
| 2019 | $2,904 | $82,880 | $17,220 | $65,660 |
| 2018 | $2,489 | $67,660 | $15,960 | $51,700 |
| 2017 | $2,513 | $67,660 | $15,960 | $51,700 |
| 2016 | $2,478 | $67,660 | $15,960 | $51,700 |
| 2015 | $2,386 | $62,650 | $14,770 | $47,880 |
| 2014 | $2,386 | $62,650 | $14,770 | $47,880 |
| 2013 | $2,402 | $62,650 | $14,770 | $47,880 |
Source: Public Records
Map
Nearby Homes
- 1595 Fox Run
- 2385 Worthington Dr
- 1345 Kenton Way
- 1811 Greenbriar Dr
- 2778 Southside Dr
- 1181 Winchester Dr
- 2927 Huntington Dr
- 2924 Huntington Dr
- 2880 Manor Ct
- 2972 Huntington Dr
- 1369 Goldenrod Dr
- 1432 Goldenrod Dr
- 1464 Goldenrod Dr
- 1470 Goldenrod Dr
- 612 Barnhart Rd
- 2904 Hoying Dr
- 2928 Hoying Dr
- 2863 Netherfield Cir
- 2944 Hoying Dr
- 606 Barnhart Rd
- 1575 Fox Run
- 1525 Fox Run
- 1760 Normandy Ln
- 2144 Canterbury Ct
- 1495 Fox Run
- 1695 Barnhart Rd
- 1520 Fox Run
- 2124 Canterbury Ct
- 1763 Normandy Ln
- 1675 Barnhart Rd
- 2160 Canterbury Ct
- 1615 Fox Run
- 1490 Fox Run
- 1780 Normandy Ln
- 1600 Fox Run
- 2104 Canterbury Ct
- 1655 Barnhart Rd
- 1815 Barnhart Rd
- 1785 Normandy Ln
- 2086 Canterbury Ct
Your Personal Tour Guide
Ask me questions while you tour the home.