Estimated Value: $263,000 - $363,060
--
Bed
--
Bath
--
Sq Ft
6,621
Sq Ft Lot
About This Home
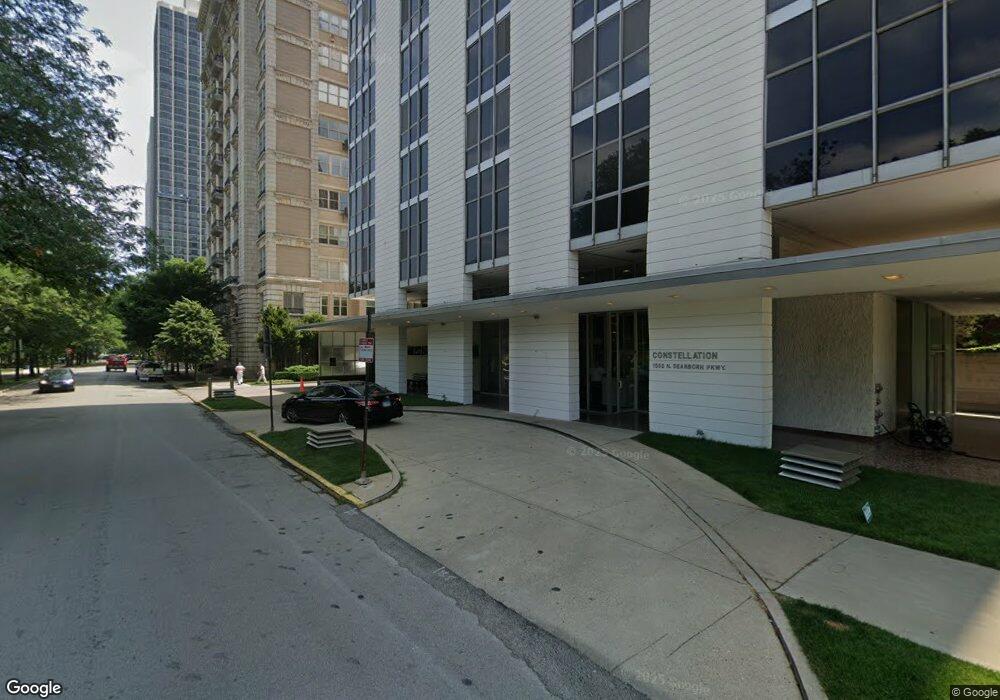
This home is located at 1555 N Dearborn Pkwy Unit 17A, Chicago, IL 60610 and is currently estimated at $301,265. 1555 N Dearborn Pkwy Unit 17A is a home located in Cook County with nearby schools including Ogden Elementary School, Lincoln Park High School, and The Latin School Of Chicago.
Ownership History
Date
Name
Owned For
Owner Type
Purchase Details
Closed on
Jun 8, 2020
Sold by
C1 T & A Investment Llc
Bought by
Mccracken Thomas J and Tobias Jennifer
Current Estimated Value
Purchase Details
Closed on
Jul 5, 2019
Sold by
Chen Tim Junting and Hsiao Angel M
Bought by
C1 T And A Investment Llc
Purchase Details
Closed on
Jun 7, 2019
Sold by
Herold Kimerlee S
Bought by
Clien Tim Jun Ting and Hsiao Angel M
Purchase Details
Closed on
Jan 28, 2015
Sold by
Krema Ronald E and Milasius Elizabeth A
Bought by
Herold Kimberlee S and Kimberlee S Herold Revocable Trust
Purchase Details
Closed on
Mar 3, 1996
Sold by
Krema Ronald E
Bought by
Krema Ronald E and Milasius Elizabeth A
Home Financials for this Owner
Home Financials are based on the most recent Mortgage that was taken out on this home.
Original Mortgage
$130,000
Interest Rate
7.05%
Create a Home Valuation Report for This Property
The Home Valuation Report is an in-depth analysis detailing your home's value as well as a comparison with similar homes in the area
Home Values in the Area
Average Home Value in this Area
Purchase History
| Date | Buyer | Sale Price | Title Company |
|---|---|---|---|
| Mccracken Thomas J | $490,000 | Chicago Title | |
| C1 T And A Investment Llc | -- | Attorney | |
| Clien Tim Jun Ting | $310,000 | Fidelity National Title | |
| Herold Kimberlee S | $475,000 | None Available | |
| Krema Ronald E | -- | Equity Title |
Source: Public Records
Mortgage History
| Date | Status | Borrower | Loan Amount |
|---|---|---|---|
| Previous Owner | Krema Ronald E | $130,000 |
Source: Public Records
Tax History Compared to Growth
Tax History
| Year | Tax Paid | Tax Assessment Tax Assessment Total Assessment is a certain percentage of the fair market value that is determined by local assessors to be the total taxable value of land and additions on the property. | Land | Improvement |
|---|---|---|---|---|
| 2024 | $4,711 | $29,555 | $2,507 | $27,048 |
| 2023 | $4,554 | $28,296 | $2,018 | $26,278 |
| 2022 | $4,554 | $28,296 | $2,018 | $26,278 |
| 2021 | $4,485 | $28,296 | $2,018 | $26,278 |
| 2020 | $5,462 | $24,519 | $1,412 | $23,107 |
| 2019 | $4,657 | $26,609 | $1,412 | $25,197 |
| 2018 | $4,578 | $26,609 | $1,412 | $25,197 |
| 2017 | $4,634 | $24,902 | $1,130 | $23,772 |
| 2016 | $4,487 | $24,902 | $1,130 | $23,772 |
| 2015 | $4,083 | $24,902 | $1,130 | $23,772 |
| 2014 | $3,857 | $23,357 | $908 | $22,449 |
| 2013 | $3,973 | $24,473 | $908 | $23,565 |
Source: Public Records
About This Building
Map
Nearby Homes
- 1555 N Dearborn Pkwy Unit 7E
- 1555 N Dearborn Pkwy Unit 10E-D
- 1555 N Dearborn Pkwy Unit 4C
- 1555 N Dearborn Pkwy Unit 8C
- 1550 N State Pkwy Unit 501
- 1550 N State Pkwy Unit LIB-ABC
- 1544 N State Pkwy Unit 3A
- 1540 N Dearborn Pkwy
- 1516 N State Pkwy Unit 5D
- 1501 N State Pkwy Unit 10B
- 1550 N Clark St Unit 704
- 1550 N Clark St Unit 604
- 1454 N Dearborn St
- 1500 N Astor St Unit 6
- 1447 N Dearborn St Unit 2S
- 1447 N Dearborn St Unit 2N
- 1447 N Dearborn St Unit 3N
- 1447 N Dearborn St Unit 1S
- 1447 N Dearborn St Unit 3S
- 1447 N Dearborn St Unit 1N
- 1555 N Dearborn Pkwy Unit 17AB
- 1555 N Dearborn Pkwy Unit 14E
- 1555 N Dearborn Pkwy Unit 9C
- 1555 N Dearborn Pkwy Unit 27D
- 1555 N Dearborn Pkwy Unit 8A
- 1555 N Dearborn Pkwy Unit 6C
- 1555 N Dearborn Pkwy Unit 4B
- 1555 N Dearborn Pkwy Unit 24A
- 1555 N Dearborn Pkwy Unit 22A
- 1555 N Dearborn Pkwy Unit 22C
- 1555 N Dearborn Pkwy Unit 22E
- 1555 N Dearborn Pkwy Unit 22B
- 1555 N Dearborn Pkwy Unit 9B
- 1555 N Dearborn Pkwy Unit 7D
- 1555 N Dearborn Pkwy Unit 14A
- 1555 N Dearborn Pkwy Unit 14AB
- 1555 N Dearborn Pkwy Unit 24E
- 1555 N Dearborn Pkwy Unit 19A
- 1555 N Dearborn Pkwy
- 1555 N Dearborn Pkwy Unit 12D