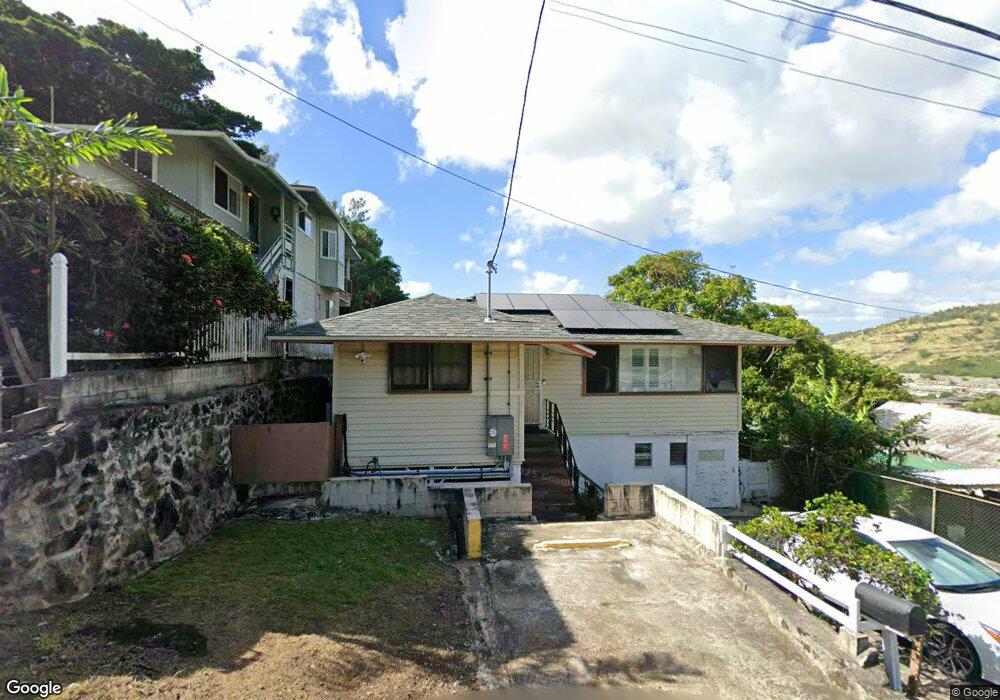
1555 Noe St Honolulu, HI 96819
Kalihi Valley NeighborhoodEstimated Value: $757,000 - $981,000
4
Beds
1
Bath
1,012
Sq Ft
$850/Sq Ft
Est. Value
About This Home
This home is located at 1555 Noe St, Honolulu, HI 96819 and is currently estimated at $860,467, approximately $850 per square foot. 1555 Noe St is a home located in Honolulu County with nearby schools including Kalihi Uka Elementary School, Governor Sanford B Dole Middle School, and Gov. Wallace Rider Farrington High School.
Ownership History
Date
Name
Owned For
Owner Type
Purchase Details
Closed on
Oct 3, 2003
Sold by
Tumbaga Adriano Charles and Tumbaga Julie
Bought by
Shikiya Raymond T and Nishiyama Paige H
Current Estimated Value
Home Financials for this Owner
Home Financials are based on the most recent Mortgage that was taken out on this home.
Original Mortgage
$306,000
Outstanding Balance
$143,385
Interest Rate
6.27%
Mortgage Type
Unknown
Estimated Equity
$717,082
Purchase Details
Closed on
Apr 1, 2003
Sold by
Ba Mortgage Llc
Bought by
Tumbaga Adriano Charles and Tumbaga Julie
Home Financials for this Owner
Home Financials are based on the most recent Mortgage that was taken out on this home.
Original Mortgage
$119,700
Interest Rate
3.75%
Mortgage Type
Unknown
Purchase Details
Closed on
Apr 13, 1994
Sold by
Suzuki Kazutomo
Bought by
Nishihata Osamu
Create a Home Valuation Report for This Property
The Home Valuation Report is an in-depth analysis detailing your home's value as well as a comparison with similar homes in the area
Home Values in the Area
Average Home Value in this Area
Purchase History
| Date | Buyer | Sale Price | Title Company |
|---|---|---|---|
| Shikiya Raymond T | $340,000 | -- | |
| Tumbaga Adriano Charles | $133,000 | -- | |
| Nishihata Osamu | $15,900 | -- | |
| Nishihata Osamu | $1,000 | -- | |
| Nishihata Osamu | $1,000 | -- |
Source: Public Records
Mortgage History
| Date | Status | Borrower | Loan Amount |
|---|---|---|---|
| Open | Shikiya Raymond T | $306,000 | |
| Previous Owner | Tumbaga Adriano Charles | $119,700 |
Source: Public Records
Tax History Compared to Growth
Tax History
| Year | Tax Paid | Tax Assessment Tax Assessment Total Assessment is a certain percentage of the fair market value that is determined by local assessors to be the total taxable value of land and additions on the property. | Land | Improvement |
|---|---|---|---|---|
| 2025 | $2,450 | $861,700 | $780,000 | $81,700 |
| 2024 | $2,450 | $859,900 | $800,000 | $59,900 |
| 2023 | $2,250 | $882,900 | $800,000 | $82,900 |
| 2022 | $2,185 | $764,200 | $640,000 | $124,200 |
| 2021 | $1,797 | $653,400 | $580,000 | $73,400 |
| 2020 | $1,880 | $677,200 | $600,000 | $77,200 |
| 2019 | $1,864 | $652,700 | $600,000 | $52,700 |
| 2018 | $1,572 | $569,100 | $540,000 | $29,100 |
| 2017 | $1,533 | $558,000 | $510,000 | $48,000 |
| 2016 | $1,690 | $602,800 | $480,000 | $122,800 |
| 2015 | $1,543 | $560,900 | $480,000 | $80,900 |
| 2014 | $1,243 | $532,100 | $410,000 | $122,100 |
Source: Public Records
Map
Nearby Homes
- 1565 Noe St
- 1565 Moani St
- 1605 Merkle St
- 1581 Murphy St
- 1561 Ahihi St
- 1654 Mahani Loop
- 1829 Akone Place
- 1835 Akone Place
- 2871-F Kalihi St
- 2704 Kalihi St
- 2757 Piliwai St
- 2871 Kalihi St Unit H
- 2840C Kalihi St
- 1592 Perry St
- 1709 Perry St
- 2202 Wilson St
- 2930 Laelae Way
- 1570 Ohu St
- 2123 Wilson St
- 3043 Numana Rd