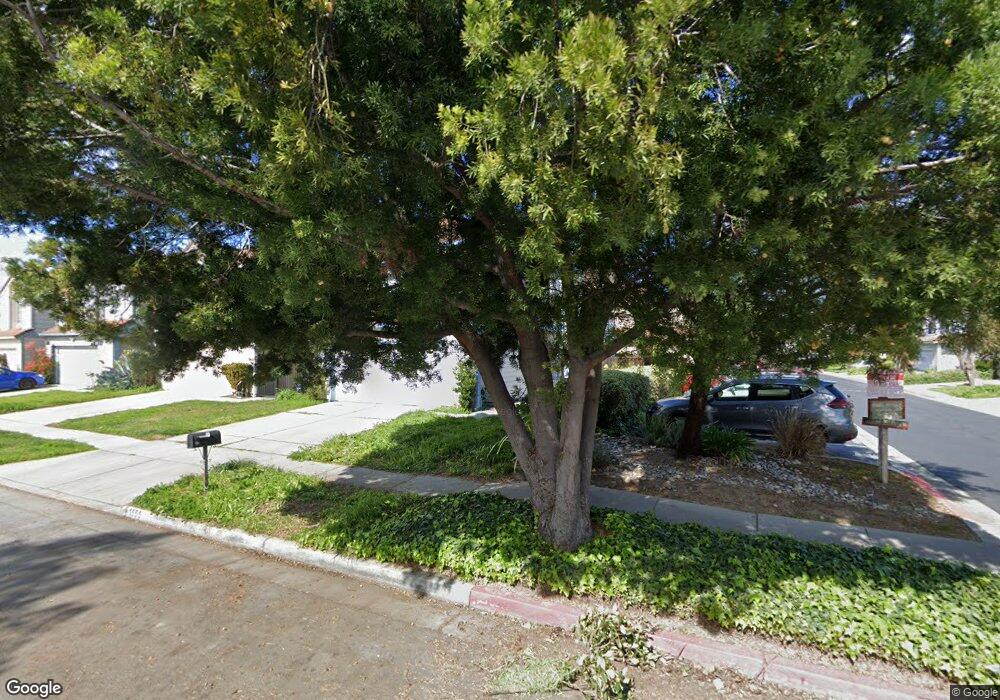
1555 Valley Crest Dr San Jose, CA 95131
Notting Hill-Royal Crest NeighborhoodEstimated Value: $1,514,000 - $1,712,000
4
Beds
3
Baths
1,802
Sq Ft
$896/Sq Ft
Est. Value
About This Home
This home is located at 1555 Valley Crest Dr, San Jose, CA 95131 and is currently estimated at $1,614,187, approximately $895 per square foot. 1555 Valley Crest Dr is a home located in Santa Clara County with nearby schools including Vinci Park Elementary School, Morrill Middle School, and Independence High School.
Ownership History
Date
Name
Owned For
Owner Type
Purchase Details
Closed on
Sep 16, 2011
Sold by
Eugenio Rey R and Eugenio Marianida D
Bought by
Chen Tian Cheng
Current Estimated Value
Purchase Details
Closed on
Sep 15, 2011
Sold by
Deng Ruowei
Bought by
Chen Tian Cheng
Purchase Details
Closed on
Jan 2, 2002
Sold by
Eugenio Rey R
Bought by
Eugenio Rey R and Eugenio Marianida D
Home Financials for this Owner
Home Financials are based on the most recent Mortgage that was taken out on this home.
Original Mortgage
$345,000
Interest Rate
7.01%
Purchase Details
Closed on
Mar 26, 1997
Sold by
Leung Ric C and Leung Mony K
Bought by
Eugenio Reigene R and Eugenio Rey
Home Financials for this Owner
Home Financials are based on the most recent Mortgage that was taken out on this home.
Original Mortgage
$261,000
Interest Rate
7.56%
Create a Home Valuation Report for This Property
The Home Valuation Report is an in-depth analysis detailing your home's value as well as a comparison with similar homes in the area
Home Values in the Area
Average Home Value in this Area
Purchase History
| Date | Buyer | Sale Price | Title Company |
|---|---|---|---|
| Chen Tian Cheng | $560,000 | Chicago Title Company | |
| Chen Tian Cheng | -- | Chicago Title Company | |
| Eugenio Rey R | -- | Stewart Title | |
| Eugenio Rey R | $252,000 | Stewart Title | |
| Jimeno Rayne E | -- | Stewart Title | |
| Eugenio Reigene R | $290,000 | Fidelity National Title Co |
Source: Public Records
Mortgage History
| Date | Status | Borrower | Loan Amount |
|---|---|---|---|
| Previous Owner | Eugenio Rey R | $345,000 | |
| Previous Owner | Eugenio Reigene R | $261,000 |
Source: Public Records
Tax History Compared to Growth
Tax History
| Year | Tax Paid | Tax Assessment Tax Assessment Total Assessment is a certain percentage of the fair market value that is determined by local assessors to be the total taxable value of land and additions on the property. | Land | Improvement |
|---|---|---|---|---|
| 2025 | $10,240 | $703,379 | $281,351 | $422,028 |
| 2024 | $10,240 | $689,588 | $275,835 | $413,753 |
| 2023 | $10,054 | $676,068 | $270,427 | $405,641 |
| 2022 | $10,013 | $662,813 | $265,125 | $397,688 |
| 2021 | $9,689 | $649,818 | $259,927 | $389,891 |
| 2020 | $9,389 | $643,156 | $257,262 | $385,894 |
| 2019 | $9,032 | $630,546 | $252,218 | $378,328 |
| 2018 | $8,904 | $618,183 | $247,273 | $370,910 |
| 2017 | $8,956 | $606,063 | $242,425 | $363,638 |
| 2016 | $8,585 | $594,180 | $237,672 | $356,508 |
| 2015 | $8,486 | $585,255 | $234,102 | $351,153 |
| 2014 | $7,787 | $573,792 | $229,517 | $344,275 |
Source: Public Records
Map
Nearby Homes
- 1233 Briarleaf Cir
- 1538 Neleigh Place
- 1660 Solari Place
- 1036 Onofrio Ln Unit 6
- 1210 Briarcreek Ct
- 1146 Rosebriar Way
- 1337 Araujo St
- 1767 Clove Ct
- 1368 Neleigh Place
- 1612 Parkview Green Cir
- 1713 Winston St
- 1441 Rocklin Ct Unit 112
- 1399 Meadow Ridge Cir
- 900 Golden Wheel Unit 67
- 900 Golden Wheel Park Dr Unit 29
- 900 Golden Wheel Park Dr Unit 66
- 1358 Oakland Rd Unit 81
- 1809 Sageland Dr
- 0 Lundy Ave
- 2044 Voss Park Ln
- 1545 Valley Crest Dr
- 1207 Briarleaf Cir
- 1535 Valley Crest Dr
- 1209 Briarleaf Cir
- 1525 Valley Crest Dr
- 1241 Briarleaf Cir
- 1204 Briarleaf Cir
- 1202 Briarleaf Cir
- 1206 Briarleaf Cir
- 1211 Briarleaf Cir
- 1239 Briarleaf Cir
- 1208 Briarleaf Cir
- 1556 Valley Crest Dr
- 1213 Briarleaf Cir
- 1550 Valley Crest Dr
- 1237 Briarleaf Cir
- 1562 Valley Crest Dr
- 1540 Valley Crest Dr
- 1212 Briarleaf Cir
- 1568 Valley Crest Dr