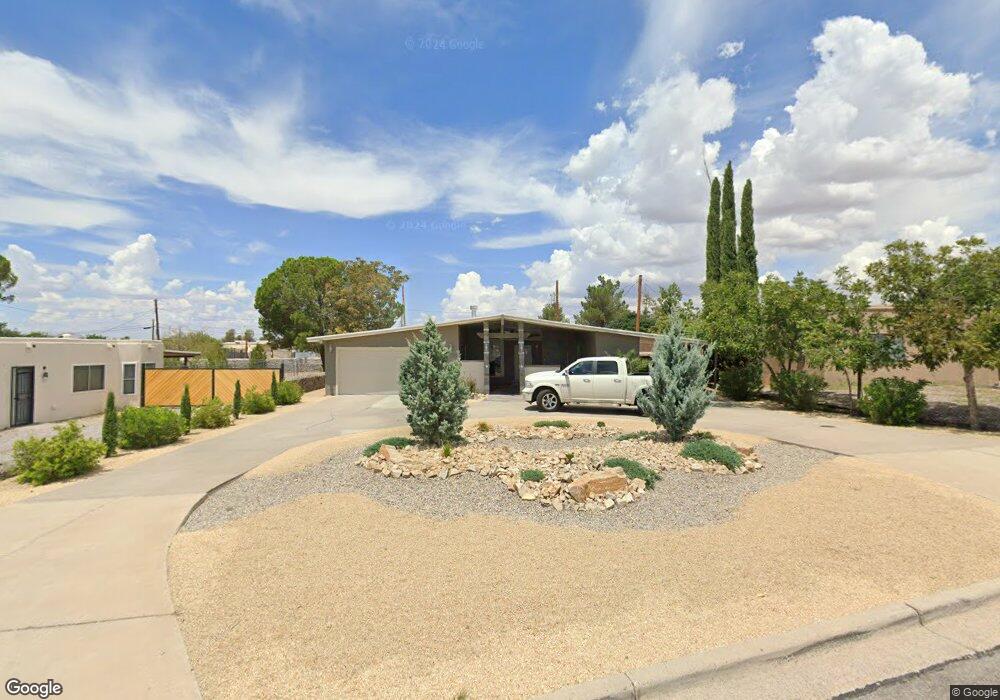
1555 Wofford Dr Las Cruces, NM 88001
Estimated Value: $221,979 - $234,000
3
Beds
2
Baths
1,640
Sq Ft
$139/Sq Ft
Est. Value
About This Home
This home is located at 1555 Wofford Dr, Las Cruces, NM 88001 and is currently estimated at $227,990, approximately $139 per square foot. 1555 Wofford Dr is a home located in Dona Ana County with nearby schools including University Hills Elementary School, Lynn Middle School, and Centennial High School.
Ownership History
Date
Name
Owned For
Owner Type
Purchase Details
Closed on
Jun 27, 2018
Sold by
Wells Fargo Bank N A
Bought by
Build X Llc
Current Estimated Value
Purchase Details
Closed on
May 18, 2017
Sold by
Doyle Robert A
Bought by
Wells Fargo Bank Na
Purchase Details
Closed on
Nov 13, 2009
Sold by
Davis Ross Lyons and Davis Gilbert P
Bought by
Lopez Daniel R
Home Financials for this Owner
Home Financials are based on the most recent Mortgage that was taken out on this home.
Original Mortgage
$136,671
Interest Rate
4.9%
Mortgage Type
FHA
Purchase Details
Closed on
Jun 6, 2003
Sold by
Berryhill Leslie W and Berryhill Barbara F
Bought by
Davis Ross Lyons and Davis Gilbert P
Home Financials for this Owner
Home Financials are based on the most recent Mortgage that was taken out on this home.
Original Mortgage
$105,525
Interest Rate
5.65%
Mortgage Type
FHA
Create a Home Valuation Report for This Property
The Home Valuation Report is an in-depth analysis detailing your home's value as well as a comparison with similar homes in the area
Home Values in the Area
Average Home Value in this Area
Purchase History
| Date | Buyer | Sale Price | Title Company |
|---|---|---|---|
| Build X Llc | -- | Bueno Title | |
| Wells Fargo Bank Na | -- | None Available | |
| Lopez Daniel R | -- | Southwestern Abstract & Titl | |
| Davis Ross Lyons | -- | Southwestern Abstract & Titl |
Source: Public Records
Mortgage History
| Date | Status | Borrower | Loan Amount |
|---|---|---|---|
| Previous Owner | Lopez Daniel R | $136,671 | |
| Previous Owner | Davis Ross Lyons | $105,525 |
Source: Public Records
Tax History Compared to Growth
Tax History
| Year | Tax Paid | Tax Assessment Tax Assessment Total Assessment is a certain percentage of the fair market value that is determined by local assessors to be the total taxable value of land and additions on the property. | Land | Improvement |
|---|---|---|---|---|
| 2024 | $1,489 | $48,876 | $8,333 | $40,543 |
| 2023 | $1,468 | $47,453 | $8,333 | $39,120 |
| 2022 | $1,445 | $46,071 | $8,333 | $37,738 |
| 2021 | $1,398 | $44,729 | $8,333 | $36,396 |
| 2020 | $1,405 | $44,729 | $8,333 | $36,396 |
| 2019 | $1,421 | $45,089 | $8,333 | $36,756 |
| 2018 | $1,197 | $38,240 | $8,333 | $29,907 |
| 2017 | $1,076 | $37,450 | $7,447 | $30,003 |
| 2016 | $1,059 | $36,359 | $7,141 | $29,218 |
| 2015 | $1,034 | $105,900 | $20,800 | $85,100 |
| 2014 | $1,033 | $105,884 | $20,806 | $85,078 |
Source: Public Records
Map
Nearby Homes
- 1350 Wofford Dr
- 1880 Rentfrow Ave
- 1825 Chaparro St
- 1423 -1425 Monte Vista Ave
- 1630 Wyoming Ave
- 1512 Andrews Dr
- 1935 Thomas Dr
- 2105 S Espina St
- 1101 Jett Ave
- 2306 S Espina St
- 2090 Payne Ct
- 1408 Lees Dr
- 1500 Gladys Dr
- 1641 Stull Dr
- 1640 E Idaho Ave
- 1491 Alamo St Unit D
- 1928 Princess Jeanne Dr
- 1929 Newton St
- 1401 Alamo St Unit B
- 1609 Stull Dr
- 1565 Wofford Dr
- 1465 Wofford Dr
- 1538 Garrison Ave
- 1536 Corbett Dr
- 1534 Corbett Dr
- 1532 Corbett Dr
- 1455 Wofford Dr
- 1442 Wofford Dr
- 1530 Corbett Dr
- 1436 Wofford Dr
- 1448 Wofford Dr
- 1430 Wofford Dr
- 1878 S Locust St Unit A
- 1424 Wofford Dr
- 1435 Wofford Dr
- 1533 Corbett Dr
- 1515 Myrtle Ave
- 1531 Corbett Dr
- 1525 Myrtle Ave
- 1535 Corbett Dr