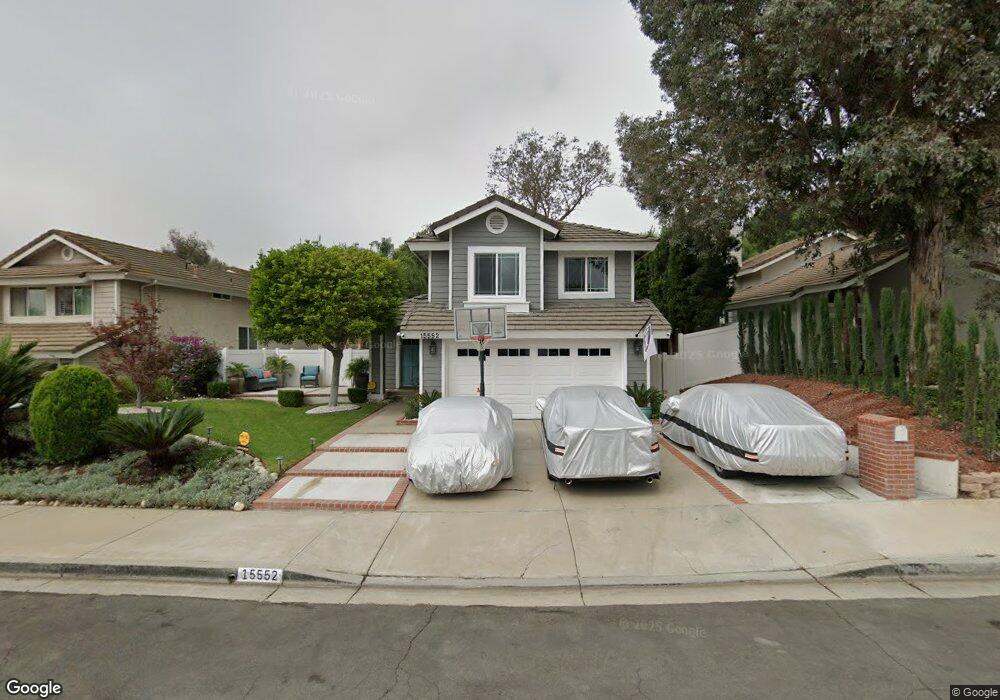
15552 Oakdale Rd Chino Hills, CA 91709
South Chino Hills NeighborhoodEstimated Value: $758,636 - $969,000
3
Beds
3
Baths
1,440
Sq Ft
$614/Sq Ft
Est. Value
About This Home
This home is located at 15552 Oakdale Rd, Chino Hills, CA 91709 and is currently estimated at $883,909, approximately $613 per square foot. 15552 Oakdale Rd is a home located in San Bernardino County with nearby schools including Oak Ridge Elementary School, Robert O. Townsend Junior High School, and Chino Hills High School.
Ownership History
Date
Name
Owned For
Owner Type
Purchase Details
Closed on
Aug 19, 2025
Sold by
Lopez Jorge
Bought by
Jorge Lopez Revocable Trust and Lopez
Current Estimated Value
Purchase Details
Closed on
Mar 1, 2002
Sold by
Markland Vance
Bought by
Lopez Jorge
Home Financials for this Owner
Home Financials are based on the most recent Mortgage that was taken out on this home.
Original Mortgage
$39,750
Interest Rate
6.78%
Mortgage Type
Credit Line Revolving
Purchase Details
Closed on
Mar 4, 1998
Sold by
Duran Rudy and Duran Tracy A
Bought by
Markland Vance P and Markland Tomoko T
Home Financials for this Owner
Home Financials are based on the most recent Mortgage that was taken out on this home.
Original Mortgage
$146,200
Interest Rate
7.99%
Create a Home Valuation Report for This Property
The Home Valuation Report is an in-depth analysis detailing your home's value as well as a comparison with similar homes in the area
Home Values in the Area
Average Home Value in this Area
Purchase History
| Date | Buyer | Sale Price | Title Company |
|---|---|---|---|
| Jorge Lopez Revocable Trust | -- | None Listed On Document | |
| Lopez Jorge | $265,000 | Fidelity National Title Co | |
| Markland Vance | -- | Fidelity National Title | |
| Markland Vance P | $172,000 | Chicago Title Co |
Source: Public Records
Mortgage History
| Date | Status | Borrower | Loan Amount |
|---|---|---|---|
| Previous Owner | Markland Vance | $39,750 | |
| Previous Owner | Lopez Jorge | $212,000 | |
| Previous Owner | Markland Vance P | $146,200 |
Source: Public Records
Tax History Compared to Growth
Tax History
| Year | Tax Paid | Tax Assessment Tax Assessment Total Assessment is a certain percentage of the fair market value that is determined by local assessors to be the total taxable value of land and additions on the property. | Land | Improvement |
|---|---|---|---|---|
| 2025 | $4,757 | $391,487 | $137,019 | $254,468 |
| 2024 | $4,757 | $383,810 | $134,332 | $249,478 |
| 2023 | $4,640 | $376,284 | $131,698 | $244,586 |
| 2022 | $4,615 | $368,906 | $129,116 | $239,790 |
| 2021 | $4,535 | $361,672 | $126,584 | $235,088 |
| 2020 | $4,483 | $357,963 | $125,286 | $232,677 |
| 2019 | $4,414 | $350,944 | $122,829 | $228,115 |
| 2018 | $4,328 | $344,063 | $120,421 | $223,642 |
| 2017 | $4,259 | $337,317 | $118,060 | $219,257 |
| 2016 | $4,013 | $330,703 | $115,745 | $214,958 |
| 2015 | $3,943 | $325,735 | $114,006 | $211,729 |
| 2014 | $3,875 | $319,355 | $111,773 | $207,582 |
Source: Public Records
Map
Nearby Homes
- 15507 Oakdale Rd
- 15413 Oakgrove Ct
- 15526 Oakhurst St
- 3099 Oaktrail Rd
- 15531 Oakflats Rd
- 15740 Willow Run Dr
- 0 Valle Vista Dr
- 3107 Morningside Dr
- 15520 Ficus St
- 3072 Crape Myrtle Cir
- 3581 Hillsdale Ranch Rd
- 15358 Morningside Dr
- 2918 Crape Myrtle Cir
- 3027 Spyglass Ct
- 3150 Oakcrest Dr
- 3741 Aspen Ln
- 3474 Autumn Ave
- 3692 Glen Ridge Dr
- 3473 Terrace Dr
- 15770 Pistachio St
- 15544 Oakdale Rd
- 15560 Oakdale Rd
- 15568 Oakdale Rd
- 15536 Oakdale Rd
- 15543 Oakdale Rd
- 15549 Oakdale Rd
- 15537 Oakdale Rd
- 15576 Oakdale Rd
- 3221 Oakleaf Ct
- 3227 Oakleaf Ct
- 15555 Oakdale Rd
- 3233 Oakleaf Ct
- 15531 Oakdale Rd
- 3213 Oakleaf Ct
- 15561 Oakdale Rd
- 3239 Oakleaf Ct
- 15525 Oakdale Rd
- 15565 Oakdale Rd
- 15582 Oakdale Rd
- 3245 Oakleaf Ct