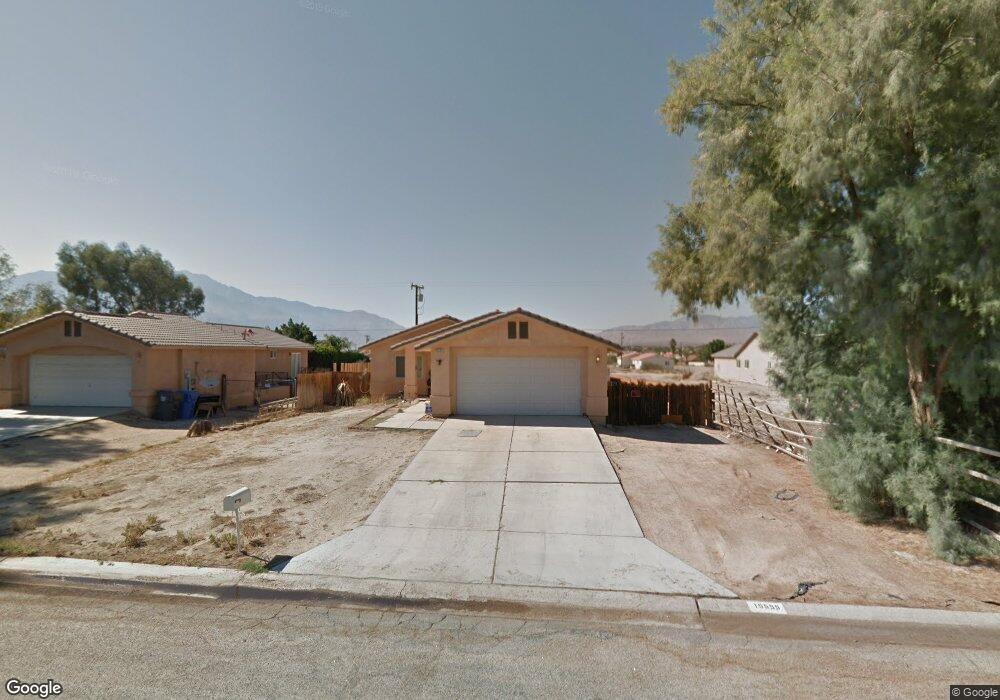
15555 Bubbling Wells Rd Desert Hot Springs, CA 92240
Estimated Value: $178,000 - $375,000
3
Beds
2
Baths
1,194
Sq Ft
$263/Sq Ft
Est. Value
About This Home
This home is located at 15555 Bubbling Wells Rd, Desert Hot Springs, CA 92240 and is currently estimated at $314,298, approximately $263 per square foot. 15555 Bubbling Wells Rd is a home located in Riverside County with nearby schools including Bubbling Wells Elementary School, Desert Springs Middle School, and Desert Hot Springs High School.
Ownership History
Date
Name
Owned For
Owner Type
Purchase Details
Closed on
Apr 13, 2011
Sold by
Calderon Aravella Fabian
Bought by
Castro Jose
Current Estimated Value
Home Financials for this Owner
Home Financials are based on the most recent Mortgage that was taken out on this home.
Original Mortgage
$82,383
Outstanding Balance
$56,943
Interest Rate
4.84%
Mortgage Type
New Conventional
Estimated Equity
$257,355
Purchase Details
Closed on
Jan 24, 2007
Sold by
Neighborhood Choice Dynamic Realty Inc
Bought by
Calderon Aravella Fabian
Home Financials for this Owner
Home Financials are based on the most recent Mortgage that was taken out on this home.
Original Mortgage
$176,250
Interest Rate
6.87%
Mortgage Type
Purchase Money Mortgage
Purchase Details
Closed on
Mar 27, 2006
Sold by
Nishimoto Kanoye K and Nishimoto Keiko
Bought by
Neighborhood Choice Dynamic Realty Inc
Create a Home Valuation Report for This Property
The Home Valuation Report is an in-depth analysis detailing your home's value as well as a comparison with similar homes in the area
Home Values in the Area
Average Home Value in this Area
Purchase History
| Date | Buyer | Sale Price | Title Company |
|---|---|---|---|
| Castro Jose | $79,500 | North American Title Company | |
| Calderon Aravella Fabian | $235,000 | Fidelity Natl Title Ins Co | |
| Neighborhood Choice Dynamic Realty Inc | $100,000 | Fidelity Natl Title Ins Co |
Source: Public Records
Mortgage History
| Date | Status | Borrower | Loan Amount |
|---|---|---|---|
| Open | Castro Jose | $82,383 | |
| Previous Owner | Calderon Aravella Fabian | $176,250 |
Source: Public Records
Tax History Compared to Growth
Tax History
| Year | Tax Paid | Tax Assessment Tax Assessment Total Assessment is a certain percentage of the fair market value that is determined by local assessors to be the total taxable value of land and additions on the property. | Land | Improvement |
|---|---|---|---|---|
| 2025 | $1,232 | $101,837 | $15,270 | $86,567 |
| 2023 | $1,232 | $97,884 | $14,678 | $83,206 |
| 2022 | $1,257 | $95,966 | $14,391 | $81,575 |
| 2021 | $1,232 | $94,085 | $14,109 | $79,976 |
| 2020 | $1,175 | $93,121 | $13,965 | $79,156 |
| 2019 | $1,154 | $91,296 | $13,692 | $77,604 |
| 2018 | $1,131 | $89,507 | $13,424 | $76,083 |
| 2017 | $1,112 | $87,753 | $13,161 | $74,592 |
| 2016 | $1,078 | $86,033 | $12,903 | $73,130 |
| 2015 | $1,036 | $84,743 | $12,710 | $72,033 |
| 2014 | $1,027 | $83,085 | $12,462 | $70,623 |
Source: Public Records
Map
Nearby Homes
- 15515 Bubbling Wells Rd
- 15483 Avenida Atezada
- Lot 285 Under Construction
- 15315 Avenida Mirola
- 15900 Avenida Atezada
- 15435 Avenida Merced
- 0 Avenida Mirola Unit NP25135522
- 16094 Avenida Atezada
- 15500 Bubbling Wells Rd Unit 84
- 15500 Bubbling Wells Rd Unit 25
- 15500 Bubbling Wells Rd Unit 277
- 15500 Bubbling Wells Rd Unit 265
- 15500 Bubbling Wells Rd Unit 275
- 15500 Bubbling Wells Rd Unit 189
- 15500 Bubbling Wells Rd Unit 219
- 15500 Bubbling Wells Rd Unit 289
- 15500 Bubbling Wells Rd Unit 300
- 15500 Bubbling Wells Rd Unit 253
- 15500 Bubbling Wells Rd Unit 243
- 15500 Bubbling Wells Rd
- 15575 Bubbling Wells Rd
- 0 Bubbling Wells Rd - Lot Unit 44788182
- 0 Bubbling Wells Rd - Lot Unit 217029184DA
- 0 Bubbling Wells Rd - Lot Unit 217021636DA
- 15565 Bubbling Wells Rd
- 15529 Bubbling Wells Rd
- 15530 Avenida Rambla
- 15610 Avenida Rambla
- 15585 Bubbling Wells Rd
- 17779 Bubbling Wells Rd
- 15605 Bubbling Wells Rd
- 0 Bubbling Wells Rd Unit EV18078905
- 0 Bubbling Wells Rd Unit EV16020192
- 0 Bubbling Wells Rd Unit 219126472DA
- 0 Bubbling Wells Rd Unit 219106833DA
- 0 Bubbling Wells Rd Unit 219091140DA
- 0 Bubbling Wells Rd Unit 219074427PS
- 0 Bubbling Wells Rd Unit 219067429DA
- 0 Bubbling Wells Rd Unit 44788180
- 0 Bubbling Wells Rd Unit IV21053836