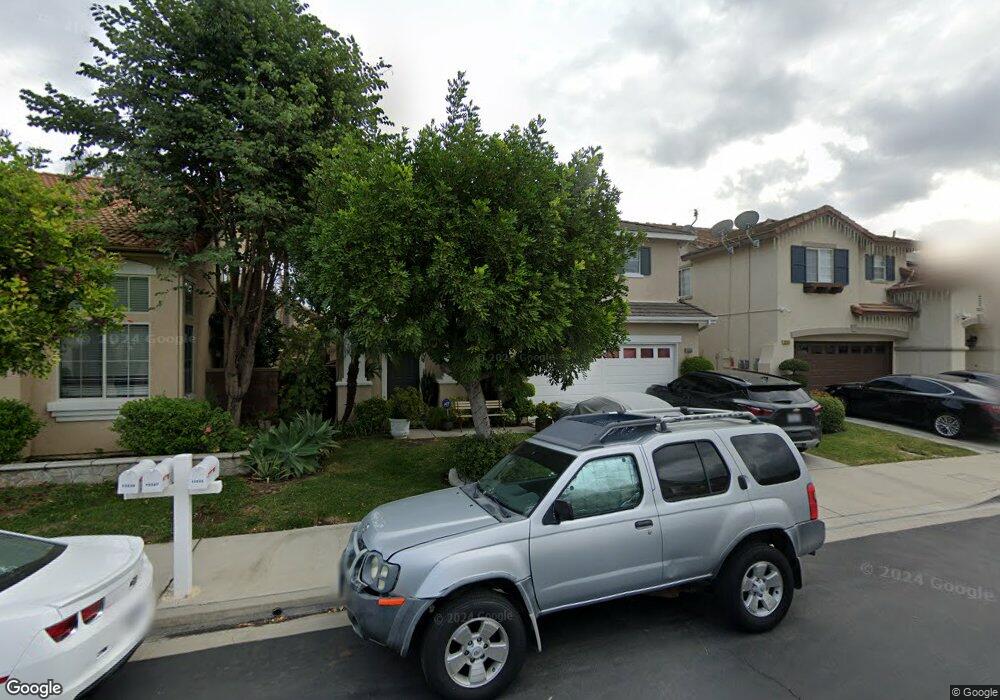
15555 Outrigger Dr Chino Hills, CA 91709
South Chino Hills NeighborhoodEstimated Value: $823,333 - $914,000
3
Beds
3
Baths
1,629
Sq Ft
$532/Sq Ft
Est. Value
About This Home
This home is located at 15555 Outrigger Dr, Chino Hills, CA 91709 and is currently estimated at $866,833, approximately $532 per square foot. 15555 Outrigger Dr is a home located in San Bernardino County with nearby schools including Chaparral Elementary School, Robert O. Townsend Junior High School, and Chino Hills High School.
Ownership History
Date
Name
Owned For
Owner Type
Purchase Details
Closed on
May 8, 2007
Sold by
Phe Boravy N and Gonzalez Boravy N
Bought by
Phe Boravy N
Current Estimated Value
Home Financials for this Owner
Home Financials are based on the most recent Mortgage that was taken out on this home.
Original Mortgage
$426,000
Outstanding Balance
$256,995
Interest Rate
6.02%
Mortgage Type
New Conventional
Estimated Equity
$609,838
Purchase Details
Closed on
Mar 12, 2001
Sold by
Gonzalez Dominic Omar
Bought by
Gonzalez Boravy N
Home Financials for this Owner
Home Financials are based on the most recent Mortgage that was taken out on this home.
Original Mortgage
$198,145
Interest Rate
7%
Purchase Details
Closed on
Mar 5, 2001
Sold by
Richmond American Homes Of Ca Inc
Bought by
Gonzalez Boravy N
Home Financials for this Owner
Home Financials are based on the most recent Mortgage that was taken out on this home.
Original Mortgage
$198,145
Interest Rate
7%
Create a Home Valuation Report for This Property
The Home Valuation Report is an in-depth analysis detailing your home's value as well as a comparison with similar homes in the area
Home Values in the Area
Average Home Value in this Area
Purchase History
| Date | Buyer | Sale Price | Title Company |
|---|---|---|---|
| Phe Boravy N | -- | Southland Title Corporation | |
| Gonzalez Boravy N | -- | Fidelity National Title Co | |
| Gonzalez Boravy N | $213,409 | Fidelity National Title Co |
Source: Public Records
Mortgage History
| Date | Status | Borrower | Loan Amount |
|---|---|---|---|
| Open | Phe Boravy N | $426,000 | |
| Previous Owner | Gonzalez Boravy N | $198,145 |
Source: Public Records
Tax History Compared to Growth
Tax History
| Year | Tax Paid | Tax Assessment Tax Assessment Total Assessment is a certain percentage of the fair market value that is determined by local assessors to be the total taxable value of land and additions on the property. | Land | Improvement |
|---|---|---|---|---|
| 2025 | $5,547 | $366,374 | $128,231 | $238,143 |
| 2024 | $5,547 | $359,191 | $125,717 | $233,474 |
| 2023 | $5,420 | $352,148 | $123,252 | $228,896 |
| 2022 | $5,381 | $345,243 | $120,835 | $224,408 |
| 2021 | $5,293 | $338,474 | $118,466 | $220,008 |
| 2020 | $5,221 | $335,003 | $117,251 | $217,752 |
| 2019 | $5,380 | $328,434 | $114,952 | $213,482 |
| 2018 | $5,267 | $321,994 | $112,698 | $209,296 |
| 2017 | $5,241 | $315,680 | $110,488 | $205,192 |
| 2016 | $5,004 | $309,491 | $108,322 | $201,169 |
| 2015 | $4,904 | $304,842 | $106,695 | $198,147 |
| 2014 | $4,824 | $298,871 | $104,605 | $194,266 |
Source: Public Records
Map
Nearby Homes
- 15597 Timberidge Ln
- 5177 Pomona Rincon Rd
- 5165 Pomona Rincon Rd
- 15610 Pomona Rincon Rd
- 0 Pomona Rincon Rd Unit TR19286701
- 15508 Quail St
- 15537 Pheasant St
- 15920 Ellington Way
- 15946 Ellington Way
- 5521 Stargaze St
- 15906 Kingston Rd
- 15849 Tanberry Dr
- 15892 Tanberry Dr
- 4718 El Molino Ln
- 15239 Murray Ave
- 5142 Cellini Dr
- 16265 Avalon Ct
- 15366 Carmelita Ave
- 15050 Monte Vista Ave Unit 126
- 15050 Monte Vista Ave Unit 115
- 15547 Outrigger Dr
- 15563 Outrigger Dr
- 15564 Lanyard Ln
- 15556 Lanyard Ln
- 15539 Outrigger Dr
- 15571 Outrigger Dr
- 15572 Lanyard Ln
- 15548 Lanyard Ln
- 15558 Outrigger Dr
- 15566 Outrigger Dr
- 15580 Lanyard Ln
- 15550 Outrigger Dr
- 15579 Outrigger Dr
- 15531 Outrigger Dr
- 15574 Outrigger Dr
- 15542 Outrigger Dr
- 15540 Lanyard Ln
- 15588 Lanyard Ln
- 15582 Outrigger Dr
- 15587 Outrigger Dr